Lesson type
Difficulty level

This lightning talk describes an automated pipline for positron emission tomography (PET) data.
Difficulty level: Intermediate
Duration: 7:27
Speaker: : Soodeh Moallemian
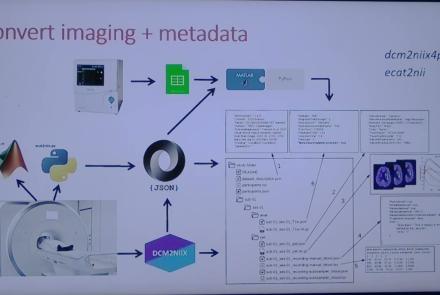
This session introduces the PET-to-BIDS (PET2BIDS) library, a toolkit designed to simplify the conversion and preparation of PET imaging datasets into BIDS-compliant formats. It supports multiple data types and formats (e.g., DICOM, ECAT7+, nifti, JSON), integrates seamlessly with Excel-based metadata, and provides automated routines for metadata updates, blood data conversion, and JSON synchronization. PET2BIDS improves human readability by mapping complex reconstruction names into standardized, descriptive labels and offers extensive documentation, examples, and video tutorials to make adoption easier for researchers.
Difficulty level: Intermediate
Duration: 9:23
Speaker: : Cyril Pernet
This session introduces the PET-to-BIDS (PET2BIDS) library, a toolkit designed to simplify the conversion and preparation of PET imaging datasets into BIDS-compliant formats. It supports multiple data types and formats (e.g., DICOM, ECAT7+, nifti, JSON), integrates seamlessly with Excel-based metadata, and provides automated routines for metadata updates, blood data conversion, and JSON synchronization. PET2BIDS improves human readability by mapping complex reconstruction names into standardized, descriptive labels and offers extensive documentation, examples, and video tutorials to make adoption easier for researchers.
Difficulty level: Intermediate
Duration: 41:04
Speaker: : Martin Nørgaard
This session dives into practical PET tooling on BIDS data—showing how to run motion correction, register PET↔MRI, extract time–activity curves, and generate standardized PET-BIDS derivatives with clear QC reports. It introduces modular BIDS Apps (head-motion correction, TAC extraction), a full pipeline (PETPrep), and a PET/MRI defacer, with guidance on parameters, outputs, provenance, and why Dockerized containers are the reliable way to run them at scale.
Difficulty level: Intermediate
Duration: 1:05:38
Speaker: : Martin Nørgaard
This session introduces two PET quantification tools—bloodstream for processing arterial blood data and kinfitr for kinetic modeling and quantification—built to work with BIDS/BIDS-derivatives and containers. Bloodstream fuses autosampler and manual measurements (whole blood, plasma, parent fraction) using interpolation or fitted models (incl. hierarchical GAMs) to produce a clean arterial input function (AIF) and whole-blood curves with rich QC reports ready. TAC data (e.g., from PETPrep) and blood (e.g., from bloodstream) can be ingested using kinfitr to run reproducible, GUI-driven analyses: define combined ROIs, calculate weighting factors, estimate blood–tissue delay, choose and chain models (e.g., 2TCM → 1TCM with parameter inheritance), and export parameters/diagnostics. Both are available as Docker apps; workflows emphasize configuration files, reports, and standard outputs to support transparency and reuse.
Difficulty level: Intermediate
Duration: 1:20:56
Speaker: : Granville Matheson

This lecture covers positron emission tomography (PET) imaging and the Brain Imaging Data Structure (BIDS), and how they work together within the PET-BIDS standard to make neuroscience more open and FAIR.
Difficulty level: Beginner
Duration: 12:06
Speaker: : Melanie Ganz

Course:
This module covers many of the types of non-invasive neurotech and neuroimaging devices including electroencephalography (EEG), electromyography (EMG), electroneurography (ENG), magnetoencephalography (MEG), and more.
Difficulty level: Beginner
Duration: 13:36
Speaker: : Harrison Canning

Course:
This tutorial introduces pipelines and methods to compute brain connectomes from fMRI data. With corresponding code and repositories, participants can follow along and learn how to programmatically preprocess, curate, and analyze functional and structural brain data to produce connectivity matrices.
Difficulty level: Intermediate
Duration: 1:39:04
Speaker: : Erin Dickie and John Griffiths

In this lightning talk, you will learn about BrainGlobe, an initiative which exists to facilitate the development of interoperable Python-based tools for computational neuroanatomy.
Difficulty level: Beginner
Duration: 3:33
Speaker: : Alessandro Felder

In this short talk you will learn about The Neural System Laboratory, which aims to develop and implement new technologies for analysis of brain architecture, connectivity, and brain-wide gene and molecular level organization.
Difficulty level: Beginner
Duration: 8:38
Speaker: : Trygve Leergard

In this lecture, you will learn about current methods, approaches, and challenges to studying human neuroanatomy, particularly through the lense of neuroimaging data such as fMRI and diffusion tensor imaging (DTI).
Difficulty level: Intermediate
Duration: 1:35:14
Speaker: : Matt Glasser

Course:
This video demonstrates each required step for preprocessing T1w anatomical data in brainlife.io.
Difficulty level: Beginner
Duration: 3:28
Speaker: :

This lesson delves into the human nervous system and the immense cellular, connectomic, and functional sophistication therein.
Difficulty level: Intermediate
Duration: 8:41
Speaker: : Marcus Ghosh

This lecture provides an introduction to the principal of anatomical organization of neural systems in the human brain and spinal cord that mediate sensation, integrate signals, and motivate behavior.
Difficulty level: Beginner
Duration: 59:57
Speaker: : Lars Klimaschewski

This lecture focuses on the comprehension of nociception and pain sensation, highlighting how the somatosensory system and different molecular partners are involved in nociception.
Difficulty level: Beginner
Duration: 28:09
Speaker: : Serena Quarta

Course:
From the retina to the superior colliculus, the lateral geniculate nucleus into primary visual cortex and beyond, this lecture gives a tour of the mammalian visual system highlighting the Nobel-prize winning discoveries of Hubel & Wiesel.
Difficulty level: Beginner
Duration: 56:31
Speaker: : Clay Reid

Course:
From Universal Turing Machines to McCulloch-Pitts and Hopfield associative memory networks, this lecture explains what is meant by computation.
Difficulty level: Beginner
Duration: 55:27
Speaker: : Christof Koch

Course:
In an overview of the structure of the mammalian neocortex, this lecture explains how the mammalian cortex is organized in a hierarchy, describing the columnar principle and canonical microcircuits.
Difficulty level: Beginner
Duration: 1:02:02
Speaker: : Clay Reid

Course:
The retina has 60 different types of neurons. What are their functions? This lecture explores the definition of cell types and their functions in the mammalian retina.
Difficulty level: Beginner
Duration: 1:07:19
Speaker: : Christof Koch

Course:
Optical imaging offers a look inside the working brain. This lecture takes a look at orientation and ocular dominance columns in the visual cortex, and shows how they can be viewed with calcium imaging.
Difficulty level: Beginner
Duration: 26:17
Speaker: : Clay Reid