Lesson type
Difficulty level

This lesson provides an overview of the current status in the field of neuroscientific ontologies, presenting examples of data organization and standards, particularly from neuroimaging and electrophysiology.
Difficulty level: Intermediate
Duration: 33:41
Speaker: : Yaroslav O. Halchenko
The lesson introduces the Brain Imaging Data Structure (BIDS), the community standard for organizing, curating, and sharing neuroimaging and associated data. The session focuses on understanding the BIDS framework, learning its data structure and validation processes.
Difficulty level: Intermediate
Duration: 38:52
Speaker: : Cyril Pernet
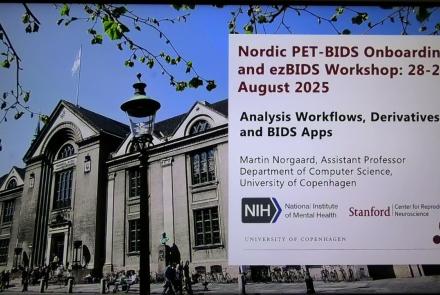
This session moves from BIDS basics into analysis workflows, focusing on how to turn raw, BIDS-organized data into derivatives using BIDS Apps and containers for reproducible processing. It compares end-to-end pipelines across fMRI and PET (and notes EEG/MEG), explains typical preprocessing choices, and shows how standardized inputs plus containerized tools (Docker/AppTainer) yield consistent, auditable outputs.
Difficulty level: Intermediate
Duration: 56:03
Speaker: : Martin Nørgaard
The session explains GDPR rules around data sharing for research in Europe, the distinction between law and ethics, and introduces practical solutions for securely sharing sensitive datasets. Researchers have more flexibility than commonly assumed: scientific research is considered a public interest task, so explicit consent for data sharing isn’t legally required, though transparency and informing participants remain ethically important. The talk also introduces publicneuro.eu, a controlled-access platform that enables sharing neuroimaging datasets with open metadata, DOIs, and customizable access restrictions while ensuring GDPR compliance.
Difficulty level: Intermediate
Duration: 31:12
Speaker: : Cyril Pernet
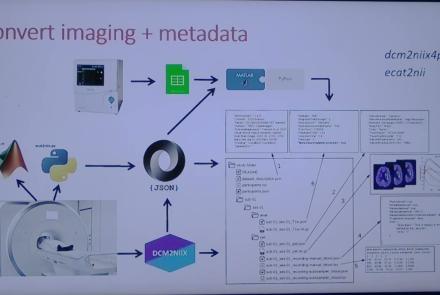
This session introduces the PET-to-BIDS (PET2BIDS) library, a toolkit designed to simplify the conversion and preparation of PET imaging datasets into BIDS-compliant formats. It supports multiple data types and formats (e.g., DICOM, ECAT7+, nifti, JSON), integrates seamlessly with Excel-based metadata, and provides automated routines for metadata updates, blood data conversion, and JSON synchronization. PET2BIDS improves human readability by mapping complex reconstruction names into standardized, descriptive labels and offers extensive documentation, examples, and video tutorials to make adoption easier for researchers.
Difficulty level: Intermediate
Duration: 9:23
Speaker: : Cyril Pernet
This session introduces the PET-to-BIDS (PET2BIDS) library, a toolkit designed to simplify the conversion and preparation of PET imaging datasets into BIDS-compliant formats. It supports multiple data types and formats (e.g., DICOM, ECAT7+, nifti, JSON), integrates seamlessly with Excel-based metadata, and provides automated routines for metadata updates, blood data conversion, and JSON synchronization. PET2BIDS improves human readability by mapping complex reconstruction names into standardized, descriptive labels and offers extensive documentation, examples, and video tutorials to make adoption easier for researchers.
Difficulty level: Intermediate
Duration: 41:04
Speaker: : Martin Nørgaard
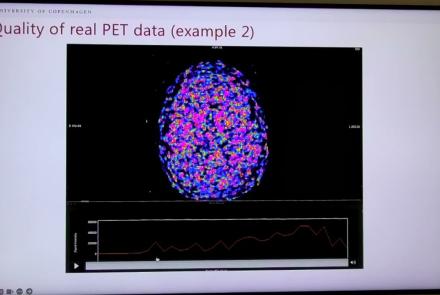
This session dives into practical PET tooling on BIDS data—showing how to run motion correction, register PET↔MRI, extract time–activity curves, and generate standardized PET-BIDS derivatives with clear QC reports. It introduces modular BIDS Apps (head-motion correction, TAC extraction), a full pipeline (PETPrep), and a PET/MRI defacer, with guidance on parameters, outputs, provenance, and why Dockerized containers are the reliable way to run them at scale.
Difficulty level: Intermediate
Duration: 1:05:38
Speaker: : Martin Nørgaard
This session introduces two PET quantification tools—bloodstream for processing arterial blood data and kinfitr for kinetic modeling and quantification—built to work with BIDS/BIDS-derivatives and containers. Bloodstream fuses autosampler and manual measurements (whole blood, plasma, parent fraction) using interpolation or fitted models (incl. hierarchical GAMs) to produce a clean arterial input function (AIF) and whole-blood curves with rich QC reports ready. TAC data (e.g., from PETPrep) and blood (e.g., from bloodstream) can be ingested using kinfitr to run reproducible, GUI-driven analyses: define combined ROIs, calculate weighting factors, estimate blood–tissue delay, choose and chain models (e.g., 2TCM → 1TCM with parameter inheritance), and export parameters/diagnostics. Both are available as Docker apps; workflows emphasize configuration files, reports, and standard outputs to support transparency and reuse.
Difficulty level: Intermediate
Duration: 1:20:56
Speaker: : Granville Matheson

This lecture covers the NIDM data format within BIDS to make your datasets more searchable, and how to optimize your dataset searches.
Difficulty level: Beginner
Duration: 12:33
Speaker: : David Keator
This lecture covers positron emission tomography (PET) imaging and the Brain Imaging Data Structure (BIDS), and how they work together within the PET-BIDS standard to make neuroscience more open and FAIR.
Difficulty level: Beginner
Duration: 12:06
Speaker: : Melanie Ganz

This lecture discusses how to standardize electrophysiology data organization to move towards being more FAIR.
Difficulty level: Beginner
Duration: 15:51
Speaker: : Sylvain Takerkart
Hierarchical Event Descriptors (HED) fill a major gap in the neuroinformatics standards toolkit, namely the specification of the nature(s) of events and time-limited conditions recorded as having occurred during time series recordings (EEG, MEG, iEEG, fMRI, etc.). Here, the HED Working Group presents an online INCF workshop on the need for, structure of, tools for, and use of HED annotation to prepare neuroimaging time series data for storing, sharing, and advanced analysis.
Difficulty level: Beginner
Duration: 03:37:42
Speaker: :

In this lesson, attendees will learn about the data structure standards, specifically the Brain Imaging Data Structure (BIDS), an INCF-endorsed standard for organizing, annotating, and describing data collected during neuroimaging experiments.
Difficulty level: Beginner
Duration: 21:56
Speaker: : Michael Schirner

This lecture covers the IBI Data Standards and Sharing Working Group, including its history, aims, and projects.
Difficulty level: Beginner
Duration: 3:58
Speaker: : Kenji Doya
This session covers the framework of the International Brain Lab (IBL) and the data architecture used for this project.
Difficulty level: Beginner
Duration: 23:37
Speaker: : Kenneth Harris

Course:
This tutorial demonstrates how to work with neuronal data using MATLAB, including actional potentials and spike counts, orientation tuing curves in visual cortex, and spatial maps of firing rates.
Difficulty level: Intermediate
Duration: 5:17
Speaker: : Mike X. Cohen

Course:
This lesson instructs users on how to import electrophysiological neural data into MATLAB, as well as how to convert spikes to a data matrix.
Difficulty level: Intermediate
Duration: 11:37
Speaker: : Mike X. Cohen

Course:
In this lesson, users will learn how to appropriately sort and bin neural spikes, allowing for the generation of a common and powerful visualization tool in neuroscience, the histogram.
Difficulty level: Intermediate
Duration: 5:31
Speaker: : Mike X. Cohen

Course:
Followers of this lesson will learn how to compute, visualize and quantify the tuning curves of individual neurons.
Difficulty level: Intermediate
Duration: 13:48
Speaker: : Mike X. Cohen

Course:
This lesson demonstrates how to programmatically generate a spatial map of neuronal spike counts using MATLAB.
Difficulty level: Intermediate
Duration: 12:16
Speaker: : Mike X. Cohen