Lesson type
Difficulty level

This lecture gives an overview of how to prepare and preprocess neuroimaging (EEG/MEG) data for use in TVB.
Difficulty level: Intermediate
Duration: 1:40:52
Speaker: : Paul Triebkorn

Course:
BioImage Suite is an integrated image analysis software suite developed at Yale University. BioImage Suite has been extensively used at different labs at Yale since about 2001.
Difficulty level: Beginner
Duration: 01:47
Speaker: : BioImage Suite

Course:
Fibr is an app for quality control of diffusion MRI images from the Healthy Brain Network, a landmark mental health study that is collecting MRI images and other assessment data from 10,000 New York City area children. The purpose of the app is to train a computer algorithm to analyze the Healthy Brain Network dataset. By playing fibr, you are helping to teach the computer which images have sufficiently good quality and which images do not.
Difficulty level: Beginner
Duration: 02:26
Speaker: : Ariel Rokem

Course:
This lecture covers the needs and challenges involved in creating a FAIR ecosystem for neuroimaging research.
Difficulty level: Beginner
Duration: 12:26
Speaker: : Camille Maumet

This lecture covers the NIDM data format within BIDS to make your datasets more searchable, and how to optimize your dataset searches.
Difficulty level: Beginner
Duration: 12:33
Speaker: : David Keator
This lecture covers the processes, benefits, and challenges involved in designing, collecting, and sharing FAIR neuroscience datasets.
Difficulty level: Beginner
Duration: 11:35
Speaker: : Julie Boyle & Valentina Borghesani
This lecture covers positron emission tomography (PET) imaging and the Brain Imaging Data Structure (BIDS), and how they work together within the PET-BIDS standard to make neuroscience more open and FAIR.
Difficulty level: Beginner
Duration: 12:06
Speaker: : Melanie Ganz
This lecture covers the benefits and difficulties involved when re-using open datasets, and how metadata is important to the process.
Difficulty level: Beginner
Duration: 11:20
Speaker: : Elizabeth DuPre
This lecture provides guidance on the ethical considerations the clinical neuroimaging community faces when applying the FAIR principles to their research.
Difficulty level: Beginner
Duration: 13:11
Speaker: : Gustav Nilsonne

Course:
This lesson provides an overview of the Miniscope project, explaining the motivation behind the how and why of Miniscope development, why Miniscopes may be useful for researchers, and the differences between previous and current versions.
Difficulty level: Beginner
Duration: 42:16
Speaker: : Daniel Aharoni
Course:
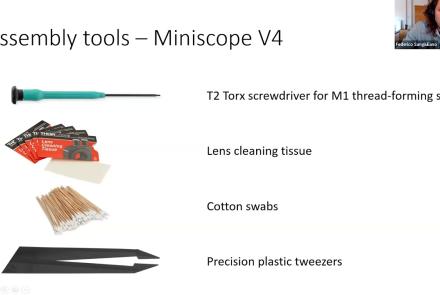
This lesson provides instruction on how to build a Miniscope and stream data, including an overview of the software involved.
Difficulty level: Beginner
Duration: 1:04:28
Speaker: : Daniel Aharoni and Federico Sangiuliano

Course:
An introduction to data management, manipulation, visualization, and analysis for neuroscience. Students will learn scientific programming in Python, and use this to work with example data from areas such as cognitive-behavioral research, single-cell recording, EEG, and structural and functional MRI. Basic signal processing techniques including filtering are covered. The course includes a Jupyter Notebook and video tutorials.
Difficulty level: Beginner
Duration: 1:09:16
Speaker: : Aaron J. Newman
Course:
This Jupyter Book is a series of interactive tutorials about quantitative T1 mapping, powered by qMRLab. Most figures are generated with Plot.ly – you can play with them by hovering your mouse over the data, zooming in (click and drag) and out (double click), moving the sliders, and changing the drop-down options. To view the code that was used to generate the figures in this blog post, hover your cursor in the top left corner of the frame that contains the tutorial and click the checkbox “All cells” in the popup that appears.
Jupyter Lab notebooks of these tutorials are also available through MyBinder, and inline code modification inside the Jupyter Book is provided by Thebelab. For both options, you can modify the code, change the figures, and regenerate the html that was used to create the tutorial below. This Jupyter Book also uses a Script of Scripts (SoS) kernel, allowing us to process the data using qMRLab in MATLAB/Octave and plot the figures with Plot.ly using Python, all within the same Jupyter Notebook.
Difficulty level: Intermediate
Duration:
Speaker: :

This lecture discusses how to standardize electrophysiology data organization to move towards being more FAIR.
Difficulty level: Beginner
Duration: 15:51
Speaker: : Sylvain Takerkart
This lecture contains an overview of the Distributed Archives for Neurophysiology Data Integration (DANDI) archive, its ties to FAIR and open-source, integrations with other programs, and upcoming features.
Difficulty level: Beginner
Duration: 13:34
Speaker: : Yaroslav O. Halchenko

This lesson contains practical exercises which accompanies the first few lessons of the Neuroscience for Machine Learners (Neuro4ML) course.
Difficulty level: Intermediate
Duration: 5:58
Speaker: : Dan Goodman

This video briefly goes over the exercises accompanying Week 6 of the Neuroscience for Machine Learners (Neuro4ML) course, Understanding Neural Networks.
Difficulty level: Intermediate
Duration: 2:43
Speaker: : Marcus Ghosh

This lesson describes the fundamentals of genomics, from central dogma to design and implementation of GWAS, to the computation, analysis, and interpretation of polygenic risk scores.
Difficulty level: Intermediate
Duration: 1:28:16
Speaker: : Dan Felsky

This is a hands-on tutorial on PLINK, the open source whole genome association analysis toolset. The aims of this tutorial are to teach users how to perform basic quality control on genetic datasets, as well as to identify and understand GWAS summary statistics.
Difficulty level: Intermediate
Duration: 1:27:18
Speaker: : Dan Felsky

This is a tutorial on using the open-source software PRSice to calculate a set of polygenic risk scores (PRS) for a study sample. Users will also learn how to read PRS into R, visualize distributions, and perform basic association analyses.
Difficulty level: Intermediate
Duration: 1:53:34
Speaker: : Dan Felsky