Lesson type
Difficulty level

This lightning talk describes an automated pipline for positron emission tomography (PET) data.
Difficulty level: Intermediate
Duration: 7:27
Speaker: : Soodeh Moallemian
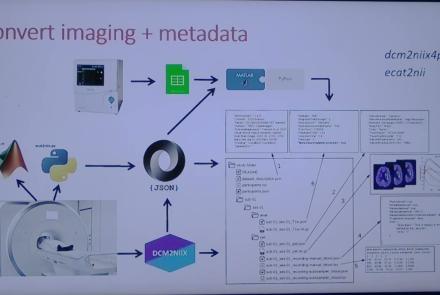
This session introduces the PET-to-BIDS (PET2BIDS) library, a toolkit designed to simplify the conversion and preparation of PET imaging datasets into BIDS-compliant formats. It supports multiple data types and formats (e.g., DICOM, ECAT7+, nifti, JSON), integrates seamlessly with Excel-based metadata, and provides automated routines for metadata updates, blood data conversion, and JSON synchronization. PET2BIDS improves human readability by mapping complex reconstruction names into standardized, descriptive labels and offers extensive documentation, examples, and video tutorials to make adoption easier for researchers.
Difficulty level: Intermediate
Duration: 9:23
Speaker: : Cyril Pernet
This session introduces the PET-to-BIDS (PET2BIDS) library, a toolkit designed to simplify the conversion and preparation of PET imaging datasets into BIDS-compliant formats. It supports multiple data types and formats (e.g., DICOM, ECAT7+, nifti, JSON), integrates seamlessly with Excel-based metadata, and provides automated routines for metadata updates, blood data conversion, and JSON synchronization. PET2BIDS improves human readability by mapping complex reconstruction names into standardized, descriptive labels and offers extensive documentation, examples, and video tutorials to make adoption easier for researchers.
Difficulty level: Intermediate
Duration: 41:04
Speaker: : Martin Nørgaard
This session dives into practical PET tooling on BIDS data—showing how to run motion correction, register PET↔MRI, extract time–activity curves, and generate standardized PET-BIDS derivatives with clear QC reports. It introduces modular BIDS Apps (head-motion correction, TAC extraction), a full pipeline (PETPrep), and a PET/MRI defacer, with guidance on parameters, outputs, provenance, and why Dockerized containers are the reliable way to run them at scale.
Difficulty level: Intermediate
Duration: 1:05:38
Speaker: : Martin Nørgaard
This session introduces two PET quantification tools—bloodstream for processing arterial blood data and kinfitr for kinetic modeling and quantification—built to work with BIDS/BIDS-derivatives and containers. Bloodstream fuses autosampler and manual measurements (whole blood, plasma, parent fraction) using interpolation or fitted models (incl. hierarchical GAMs) to produce a clean arterial input function (AIF) and whole-blood curves with rich QC reports ready. TAC data (e.g., from PETPrep) and blood (e.g., from bloodstream) can be ingested using kinfitr to run reproducible, GUI-driven analyses: define combined ROIs, calculate weighting factors, estimate blood–tissue delay, choose and chain models (e.g., 2TCM → 1TCM with parameter inheritance), and export parameters/diagnostics. Both are available as Docker apps; workflows emphasize configuration files, reports, and standard outputs to support transparency and reuse.
Difficulty level: Intermediate
Duration: 1:20:56
Speaker: : Granville Matheson

This lecture covers positron emission tomography (PET) imaging and the Brain Imaging Data Structure (BIDS), and how they work together within the PET-BIDS standard to make neuroscience more open and FAIR.
Difficulty level: Beginner
Duration: 12:06
Speaker: : Melanie Ganz

Course:
This module covers many of the types of non-invasive neurotech and neuroimaging devices including electroencephalography (EEG), electromyography (EMG), electroneurography (ENG), magnetoencephalography (MEG), and more.
Difficulty level: Beginner
Duration: 13:36
Speaker: : Harrison Canning

This lesson breaks down the principles of Bayesian inference and how it relates to cognitive processes and functions like learning and perception. It is then explained how cognitive models can be built using Bayesian statistics in order to investigate how our brains interface with their environment.
This lesson corresponds to slides 1-64 in the PDF below.
Difficulty level: Intermediate
Duration: 1:28:14
Speaker: : Andreea Diaconescu

This is a tutorial on designing a Bayesian inference model to map belief trajectories, with emphasis on gaining familiarity with Hierarchical Gaussian Filters (HGFs).
This lesson corresponds to slides 65-90 of the PDF below.
Difficulty level: Intermediate
Duration: 1:15:04
Speaker: : Daniel Hauke

This lecture covers a lot of post-war developments in the science of the mind, focusing first on the cognitive revolution, and concluding with living machines.
Difficulty level: Beginner
Duration: 2:24:35
Speaker: : Paul F.M.J. Verschure

This lecture provides an overview of depression (epidemiology and course of the disorder), clinical presentation, somatic co-morbidity, and treatment options.
Difficulty level: Beginner
Duration: 37:51
Speaker: : Barbara Sperner-Unterweger

This lesson is part 1 of 2 of a tutorial on statistical models for neural data.
Difficulty level: Beginner
Duration: 1:45:48
Speaker: : Jonathan Pillow

Course:
What is the difference between attention and consciousness? This lecture describes the scientific meaning of consciousness, journeys on the search for neural correlates of visual consciousness, and explores the possibility of consciousness in other beings and even non-biological structures.
Difficulty level: Beginner
Duration: 1:10:01
Speaker: : Christof Koch

This lecture explains the concept of federated analysis in the context of medical data, associated challenges. The lecture also presents an example of hospital federations via the Medical Informatics Platform.
Difficulty level: Intermediate
Duration: 19:15
Speaker: : Yannis Ioannidis

This lesson continues with the second workshop on reproducible science, focusing on additional open source tools for researchers and data scientists, such as the R programming language for data science, as well as associated tools like RStudio and R Markdown. Additionally, users are introduced to Python and iPython notebooks, Google Colab, and are given hands-on tutorials on how to create a Binder environment, as well as various containers in Docker and Singularity.
Difficulty level: Beginner
Duration: 1:16:04
Speaker: : Erin Dickie and Sejal Patel

This lesson contains both a lecture and a tutorial component. The lecture (0:00-20:03 of YouTube video) discusses both the need for intersectional approaches in healthcare as well as the impact of neglecting intersectionality in patient populations. The lecture is followed by a practical tutorial in both Python and R on how to assess intersectional bias in datasets. Links to relevant code and data are found below.
Difficulty level: Beginner
Duration: 52:26

This is a hands-on tutorial on PLINK, the open source whole genome association analysis toolset. The aims of this tutorial are to teach users how to perform basic quality control on genetic datasets, as well as to identify and understand GWAS summary statistics.
Difficulty level: Intermediate
Duration: 1:27:18
Speaker: : Dan Felsky

This is a tutorial on using the open-source software PRSice to calculate a set of polygenic risk scores (PRS) for a study sample. Users will also learn how to read PRS into R, visualize distributions, and perform basic association analyses.
Difficulty level: Intermediate
Duration: 1:53:34
Speaker: : Dan Felsky

This lesson is an overview of transcriptomics, from fundamental concepts of the central dogma and RNA sequencing at the single-cell level, to how genetic expression underlies diversity in cell phenotypes.
Difficulty level: Intermediate
Duration: 1:29:08
Speaker: : Shreejoy Tripathy

This is a tutorial introducing participants to the basics of RNA-sequencing data and how to analyze its features using Seurat.
Difficulty level: Intermediate
Duration: 1:19:17
Speaker: : Sonny Chen