Lesson type
Difficulty level

This lightning talk describes an automated pipline for positron emission tomography (PET) data.
Difficulty level: Intermediate
Duration: 7:27
Speaker: : Soodeh Moallemian
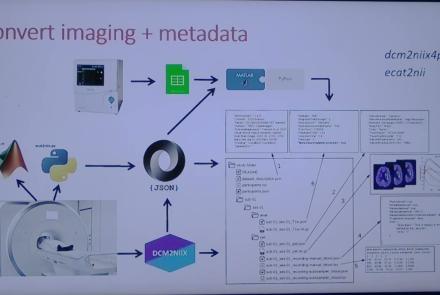
This session introduces the PET-to-BIDS (PET2BIDS) library, a toolkit designed to simplify the conversion and preparation of PET imaging datasets into BIDS-compliant formats. It supports multiple data types and formats (e.g., DICOM, ECAT7+, nifti, JSON), integrates seamlessly with Excel-based metadata, and provides automated routines for metadata updates, blood data conversion, and JSON synchronization. PET2BIDS improves human readability by mapping complex reconstruction names into standardized, descriptive labels and offers extensive documentation, examples, and video tutorials to make adoption easier for researchers.
Difficulty level: Intermediate
Duration: 9:23
Speaker: : Cyril Pernet
This session introduces the PET-to-BIDS (PET2BIDS) library, a toolkit designed to simplify the conversion and preparation of PET imaging datasets into BIDS-compliant formats. It supports multiple data types and formats (e.g., DICOM, ECAT7+, nifti, JSON), integrates seamlessly with Excel-based metadata, and provides automated routines for metadata updates, blood data conversion, and JSON synchronization. PET2BIDS improves human readability by mapping complex reconstruction names into standardized, descriptive labels and offers extensive documentation, examples, and video tutorials to make adoption easier for researchers.
Difficulty level: Intermediate
Duration: 41:04
Speaker: : Martin Nørgaard
This session dives into practical PET tooling on BIDS data—showing how to run motion correction, register PET↔MRI, extract time–activity curves, and generate standardized PET-BIDS derivatives with clear QC reports. It introduces modular BIDS Apps (head-motion correction, TAC extraction), a full pipeline (PETPrep), and a PET/MRI defacer, with guidance on parameters, outputs, provenance, and why Dockerized containers are the reliable way to run them at scale.
Difficulty level: Intermediate
Duration: 1:05:38
Speaker: : Martin Nørgaard
This session introduces two PET quantification tools—bloodstream for processing arterial blood data and kinfitr for kinetic modeling and quantification—built to work with BIDS/BIDS-derivatives and containers. Bloodstream fuses autosampler and manual measurements (whole blood, plasma, parent fraction) using interpolation or fitted models (incl. hierarchical GAMs) to produce a clean arterial input function (AIF) and whole-blood curves with rich QC reports ready. TAC data (e.g., from PETPrep) and blood (e.g., from bloodstream) can be ingested using kinfitr to run reproducible, GUI-driven analyses: define combined ROIs, calculate weighting factors, estimate blood–tissue delay, choose and chain models (e.g., 2TCM → 1TCM with parameter inheritance), and export parameters/diagnostics. Both are available as Docker apps; workflows emphasize configuration files, reports, and standard outputs to support transparency and reuse.
Difficulty level: Intermediate
Duration: 1:20:56
Speaker: : Granville Matheson

This lecture covers positron emission tomography (PET) imaging and the Brain Imaging Data Structure (BIDS), and how they work together within the PET-BIDS standard to make neuroscience more open and FAIR.
Difficulty level: Beginner
Duration: 12:06
Speaker: : Melanie Ganz

Course:
This module covers many of the types of non-invasive neurotech and neuroimaging devices including electroencephalography (EEG), electromyography (EMG), electroneurography (ENG), magnetoencephalography (MEG), and more.
Difficulty level: Beginner
Duration: 13:36
Speaker: : Harrison Canning

This lecture covers the IBI Data Standards and Sharing Working Group, including its history, aims, and projects.
Difficulty level: Beginner
Duration: 3:58
Speaker: : Kenji Doya
This session covers the framework of the International Brain Lab (IBL) and the data architecture used for this project.
Difficulty level: Beginner
Duration: 23:37
Speaker: : Kenneth Harris

Course:
This lecture introduces neuroscience concepts and methods such as fMRI, visual respones in BOLD data, and the eccentricity of visual receptive fields.
Difficulty level: Intermediate
Duration: 7:15
Speaker: : Mike X. Cohen

Course:
In this tutorial, users learn how to compute and visualize a t-test on experimental condition differences.
Difficulty level: Intermediate
Duration: 17:54
Speaker: : Mike X. Cohen

This lesson continues with the second workshop on reproducible science, focusing on additional open source tools for researchers and data scientists, such as the R programming language for data science, as well as associated tools like RStudio and R Markdown. Additionally, users are introduced to Python and iPython notebooks, Google Colab, and are given hands-on tutorials on how to create a Binder environment, as well as various containers in Docker and Singularity.
Difficulty level: Beginner
Duration: 1:16:04
Speaker: : Erin Dickie and Sejal Patel

This is a hands-on tutorial on PLINK, the open source whole genome association analysis toolset. The aims of this tutorial are to teach users how to perform basic quality control on genetic datasets, as well as to identify and understand GWAS summary statistics.
Difficulty level: Intermediate
Duration: 1:27:18
Speaker: : Dan Felsky

Course:
This video will document how to run a correlation analysis between the gray matter volume of two different structures using the output from brainlife app-freesurfer-stats.
Difficulty level: Beginner
Duration: 1:33
Speaker: :

As the previous lesson of this course described how researchers acquire neural data, this lesson will discuss how to go about interpreting and analysing the data.
Difficulty level: Intermediate
Duration: 9:24
Speaker: : Marcus Ghosh

In this lesson, you will learn about one particular aspect of decision making: reaction times. In other words, how long does it take to take a decision based on a stream of information arriving continuously over time?
Difficulty level: Intermediate
Duration: 6:01
Speaker: : Dan Goodman