Lesson type
Difficulty level

Course:
This lesson describes the principles underlying functional magnetic resonance imaging (fMRI), diffusion-weighted imaging (DWI), tractography, and parcellation. These tools and concepts are explained in a broader context of neural connectivity and mental health.
Difficulty level: Intermediate
Duration: 1:47:22
Speaker: : Erin Dickie and John Griffiths

Course:
This tutorial introduces pipelines and methods to compute brain connectomes from fMRI data. With corresponding code and repositories, participants can follow along and learn how to programmatically preprocess, curate, and analyze functional and structural brain data to produce connectivity matrices.
Difficulty level: Intermediate
Duration: 1:39:04
Speaker: : Erin Dickie and John Griffiths

This lesson introduces the practical exercises which accompany the previous lessons on animal and human connectomes in the brain and nervous system.
Difficulty level: Intermediate
Duration: 4:10
Speaker: : Dan Goodman

Course:
This lecture and tutorial focuses on measuring human functional brain networks, as well as how to account for inherent variability within those networks.
Difficulty level: Intermediate
Duration: 50:44
Speaker: : Caterina Gratton

Course:
This lecture presents an overview of functional brain parcellations, as well as a set of tutorials on bootstrap agregation of stable clusters (BASC) for fMRI brain parcellation.
Difficulty level: Advanced
Duration: 50:28
Speaker: : Pierre Bellec

Course:
This lecture introduces neuroscience concepts and methods such as fMRI, visual respones in BOLD data, and the eccentricity of visual receptive fields.
Difficulty level: Intermediate
Duration: 7:15
Speaker: : Mike X. Cohen

Course:
In this tutorial, users learn how to compute and visualize a t-test on experimental condition differences.
Difficulty level: Intermediate
Duration: 17:54
Speaker: : Mike X. Cohen

This lesson continues with the second workshop on reproducible science, focusing on additional open source tools for researchers and data scientists, such as the R programming language for data science, as well as associated tools like RStudio and R Markdown. Additionally, users are introduced to Python and iPython notebooks, Google Colab, and are given hands-on tutorials on how to create a Binder environment, as well as various containers in Docker and Singularity.
Difficulty level: Beginner
Duration: 1:16:04
Speaker: : Erin Dickie and Sejal Patel

This is a hands-on tutorial on PLINK, the open source whole genome association analysis toolset. The aims of this tutorial are to teach users how to perform basic quality control on genetic datasets, as well as to identify and understand GWAS summary statistics.
Difficulty level: Intermediate
Duration: 1:27:18
Speaker: : Dan Felsky

Course:
This video will document how to run a correlation analysis between the gray matter volume of two different structures using the output from brainlife app-freesurfer-stats.
Difficulty level: Beginner
Duration: 1:33
Speaker: :

As the previous lesson of this course described how researchers acquire neural data, this lesson will discuss how to go about interpreting and analysing the data.
Difficulty level: Intermediate
Duration: 9:24
Speaker: : Marcus Ghosh

In this lesson, you will learn about one particular aspect of decision making: reaction times. In other words, how long does it take to take a decision based on a stream of information arriving continuously over time?
Difficulty level: Intermediate
Duration: 6:01
Speaker: : Dan Goodman

Course:
Overview of the content for Day 1 of this course.
Difficulty level: Beginner
Duration: 00:01:59
Speaker: : Tristan Shuman

Course:
Overview of Day 2 of this course.
Difficulty level: Beginner
Duration: 00:03:28
Speaker: : Tristan Shuman

Course:
Best practices: the tips and tricks on how to get your Miniscope to work and how to get your experiments off the ground.
Difficulty level: Beginner
Duration: 00:53:34

Course:
This talk compares various sensors and resolutions for in vivo neural recordings.
Difficulty level: Beginner
Duration: 00:24:03
Speaker: : Susie Feng, Zach Pennington, Caleb Kemere
Course:
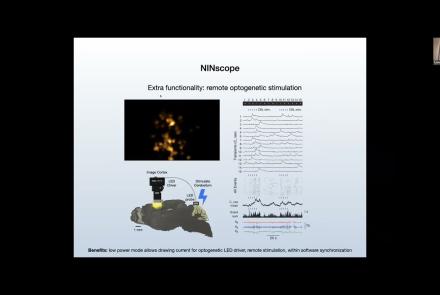
This talk delves into challenges and opportunities of Miniscope design, seeking the optimal balance between scale and function.
Difficulty level: Beginner
Duration: 00:21:51
Speaker: : Susie Feng, Zach Pennington, Tycho Hoogland

Course:
Attendees of this talk will learn aobut computational imaging systems and associated pipelines, as well as open-source software solutions supporting miniscope use.
Difficulty level: Beginner
Duration: 00:17:56
Speaker: : Susie Feng, Zach Pennington, Laura Waller

Course:
This talk covers the present state and future directions of calcium imaging data analysis, particularly in the context of one-photon vs two-photon approaches.
Difficulty level: Beginner
Duration: 00:21:06

Course:
In this talk, results from rodent experimentation using in vivo imaging are presented, demonstrating how the monitoring of neural ensembles may reveal patterns of learning during spatial tasks.
Difficulty level: Beginner
Duration: 00:19:43
Speaker: : Susie Feng, Zach Pennington, William Mau