Lesson type
Difficulty level

This lecture covers the processes, benefits, and challenges involved in designing, collecting, and sharing FAIR neuroscience datasets.
Difficulty level: Beginner
Duration: 11:35
Speaker: : Julie Boyle & Valentina Borghesani
This lecture covers positron emission tomography (PET) imaging and the Brain Imaging Data Structure (BIDS), and how they work together within the PET-BIDS standard to make neuroscience more open and FAIR.
Difficulty level: Beginner
Duration: 12:06
Speaker: : Melanie Ganz
This lecture covers the benefits and difficulties involved when re-using open datasets, and how metadata is important to the process.
Difficulty level: Beginner
Duration: 11:20
Speaker: : Elizabeth DuPre
This lecture provides guidance on the ethical considerations the clinical neuroimaging community faces when applying the FAIR principles to their research.
Difficulty level: Beginner
Duration: 13:11
Speaker: : Gustav Nilsonne
This lecture covers the ethical implications of the use of functional neuroimaging to assess covert awareness in unconscious patients and was part of the Neuro Day Workshop held by the NeuroSchool of Aix Marseille University.
Difficulty level: Beginner
Duration: 1:00:50
Speaker: : Athena Demertzi

Course:
This module covers many of the types of non-invasive neurotech and neuroimaging devices including electroencephalography (EEG), electromyography (EMG), electroneurography (ENG), magnetoencephalography (MEG), and more.
Difficulty level: Beginner
Duration: 13:36
Speaker: : Harrison Canning

Course:
This introductory lesson welcomes users to the virtual learning series, explaining some of the background behind open-source miniscopes, as well as outlining the rest of the lessons in this course.
Difficulty level: Beginner
Duration: 16:23

Course:
This lesson provides an overview of the Miniscope project, explaining the motivation behind the how and why of Miniscope development, why Miniscopes may be useful for researchers, and the differences between previous and current versions.
Difficulty level: Beginner
Duration: 42:16
Speaker: : Daniel Aharoni

Course:
This lesson will go through the theory and practical techniques for implanting a GRIN lens for imaging in mice.
Difficulty level: Beginner
Duration: 1:00:40
Speaker: : Tristan Shuman and Susie Feng
Course:
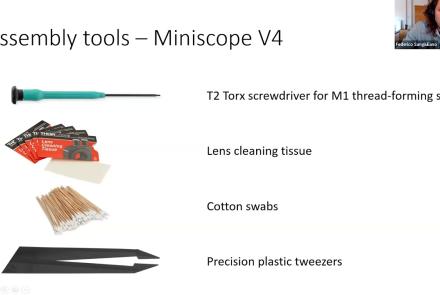
This lesson provides instruction on how to build a Miniscope and stream data, including an overview of the software involved.
Difficulty level: Beginner
Duration: 1:04:28
Speaker: : Daniel Aharoni and Federico Sangiuliano

Course:
An introduction to data management, manipulation, visualization, and analysis for neuroscience. Students will learn scientific programming in Python, and use this to work with example data from areas such as cognitive-behavioral research, single-cell recording, EEG, and structural and functional MRI. Basic signal processing techniques including filtering are covered. The course includes a Jupyter Notebook and video tutorials.
Difficulty level: Beginner
Duration: 1:09:16
Speaker: : Aaron J. Newman
Course:
This book was written with the goal of introducing researchers and students in a variety of research fields to the intersection of data science and neuroimaging. This book reflects our own experience of doing research at the intersection of data science and neuroimaging and it is based on our experience working with students and collaborators who come from a variety of backgrounds and have a variety of reasons for wanting to use data science approaches in their work. The tools and ideas that we chose to write about are all tools and ideas that we have used in some way in our own research. Many of them are tools that we use on a daily basis in our work. This was important to us for a few reasons: the first is that we want to teach people things that we ourselves find useful. Second, it allowed us to write the book with a focus on solving specific analysis tasks. For example, in many of the chapters you will see that we walk you through ideas while implementing them in code, and with data. We believe that this is a good way to learn about data analysis, because it provides a connecting thread from scientific questions through the data and its representation to implementing specific answers to these questions. Finally, we find these ideas compelling and fruitful. That’s why we were drawn to them in the first place. We hope that our enthusiasm about the ideas and tools described in this book will be infectious enough to convince the readers of their value.
Difficulty level: Intermediate
Duration:
Speaker: :
Course:
This Jupyter Book is a series of interactive tutorials about quantitative T1 mapping, powered by qMRLab. Most figures are generated with Plot.ly – you can play with them by hovering your mouse over the data, zooming in (click and drag) and out (double click), moving the sliders, and changing the drop-down options. To view the code that was used to generate the figures in this blog post, hover your cursor in the top left corner of the frame that contains the tutorial and click the checkbox “All cells” in the popup that appears.
Jupyter Lab notebooks of these tutorials are also available through MyBinder, and inline code modification inside the Jupyter Book is provided by Thebelab. For both options, you can modify the code, change the figures, and regenerate the html that was used to create the tutorial below. This Jupyter Book also uses a Script of Scripts (SoS) kernel, allowing us to process the data using qMRLab in MATLAB/Octave and plot the figures with Plot.ly using Python, all within the same Jupyter Notebook.
Difficulty level: Intermediate
Duration:
Speaker: :
Hierarchical Event Descriptors (HED) fill a major gap in the neuroinformatics standards toolkit, namely the specification of the nature(s) of events and time-limited conditions recorded as having occurred during time series recordings (EEG, MEG, iEEG, fMRI, etc.). Here, the HED Working Group presents an online INCF workshop on the need for, structure of, tools for, and use of HED annotation to prepare neuroimaging time series data for storing, sharing, and advanced analysis.
Difficulty level: Beginner
Duration: 03:37:42
Speaker: :

This lesson introduces concepts and practices surrounding reference atlases for the mouse and rat brains. Additionally, this lesson provides discussion around examples of data systems employed to organize neuroscience data collections in the context of reference atlases as well as analytical workflows applied to the data.
Difficulty level: Beginner
Duration: 03:04:29
Speaker: :