Lesson type
Difficulty level

Course:
This tutorial demonstrates how to extract the time course of calcium activity from each clusters of neuron somata, and store the data in a MATLAB matrix.
Difficulty level: Intermediate
Duration: 22:41
Speaker: : Mike X. Cohen

Course:
This lesson demonstrates how to use MATLAB to implement a multivariate dimension reduction method, PCA, on time series data.
Difficulty level: Intermediate
Duration: 17:19
Speaker: : Mike X. Cohen

Course:
This lesson describes the principles underlying functional magnetic resonance imaging (fMRI), diffusion-weighted imaging (DWI), tractography, and parcellation. These tools and concepts are explained in a broader context of neural connectivity and mental health.
Difficulty level: Intermediate
Duration: 1:47:22
Speaker: : Erin Dickie and John Griffiths

This tutorial walks participants through the application of dynamic causal modelling (DCM) to fMRI data using MATLAB. Participants are also shown various forms of DCM, how to generate and specify different models, and how to fit them to simulated neural and BOLD data.
This lesson corresponds to slides 158-187 of the PDF below.
Difficulty level: Advanced
Duration: 1:22:10
Speaker: : Peter Bedford, Povilas Karvelis

In this hands-on session, you will learn how to explore and work with DataLad datasets, containers, and structures using Jupyter notebooks.
Difficulty level: Beginner
Duration: 58:05
Speaker: : Michał Szczepanik

This lesson explores how researchers try to understand neural networks, particularly in the case of observing neural activity.
Difficulty level: Intermediate
Duration: 8:20
Speaker: : Marcus Ghosh
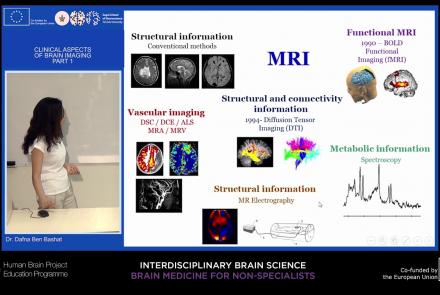
This lecture will provide an overview of neuroimaging techniques and their clinical applications.
Difficulty level: Beginner
Duration: 45:29
Speaker: : Dafna Ben Bashat

Course:
This lecture presents an overview of functional brain parcellations, as well as a set of tutorials on bootstrap agregation of stable clusters (BASC) for fMRI brain parcellation.
Difficulty level: Advanced
Duration: 50:28
Speaker: : Pierre Bellec

Course:
This lecture covers the needs and challenges involved in creating a FAIR ecosystem for neuroimaging research.
Difficulty level: Beginner
Duration: 12:26
Speaker: : Camille Maumet

This lecture covers the NIDM data format within BIDS to make your datasets more searchable, and how to optimize your dataset searches.
Difficulty level: Beginner
Duration: 12:33
Speaker: : David Keator
This lecture covers the processes, benefits, and challenges involved in designing, collecting, and sharing FAIR neuroscience datasets.
Difficulty level: Beginner
Duration: 11:35
Speaker: : Julie Boyle & Valentina Borghesani
This lecture covers positron emission tomography (PET) imaging and the Brain Imaging Data Structure (BIDS), and how they work together within the PET-BIDS standard to make neuroscience more open and FAIR.
Difficulty level: Beginner
Duration: 12:06
Speaker: : Melanie Ganz
This lecture covers the benefits and difficulties involved when re-using open datasets, and how metadata is important to the process.
Difficulty level: Beginner
Duration: 11:20
Speaker: : Elizabeth DuPre
This lecture provides guidance on the ethical considerations the clinical neuroimaging community faces when applying the FAIR principles to their research.
Difficulty level: Beginner
Duration: 13:11
Speaker: : Gustav Nilsonne

Course:
An introduction to data management, manipulation, visualization, and analysis for neuroscience. Students will learn scientific programming in Python, and use this to work with example data from areas such as cognitive-behavioral research, single-cell recording, EEG, and structural and functional MRI. Basic signal processing techniques including filtering are covered. The course includes a Jupyter Notebook and video tutorials.
Difficulty level: Beginner
Duration: 1:09:16
Speaker: : Aaron J. Newman
Course:
This Jupyter Book is a series of interactive tutorials about quantitative T1 mapping, powered by qMRLab. Most figures are generated with Plot.ly – you can play with them by hovering your mouse over the data, zooming in (click and drag) and out (double click), moving the sliders, and changing the drop-down options. To view the code that was used to generate the figures in this blog post, hover your cursor in the top left corner of the frame that contains the tutorial and click the checkbox “All cells” in the popup that appears.
Jupyter Lab notebooks of these tutorials are also available through MyBinder, and inline code modification inside the Jupyter Book is provided by Thebelab. For both options, you can modify the code, change the figures, and regenerate the html that was used to create the tutorial below. This Jupyter Book also uses a Script of Scripts (SoS) kernel, allowing us to process the data using qMRLab in MATLAB/Octave and plot the figures with Plot.ly using Python, all within the same Jupyter Notebook.
Difficulty level: Intermediate
Duration:
Speaker: :

This is the first of two workshops on reproducibility in science, during which participants are introduced to concepts of FAIR and open science. After discussing the definition of and need for FAIR science, participants are walked through tutorials on installing and using Github and Docker, the powerful, open-source tools for versioning and publishing code and software, respectively.
Difficulty level: Intermediate
Duration: 1:20:58
Speaker: : Erin Dickie and Sejal Patel

Course:
In this lesson, while learning about the need for increased large-scale collaborative science that is transparent in nature, users also are given a tutorial on using Synapse for facilitating reusable and reproducible research.
Difficulty level: Beginner
Duration: 1:15:12
Speaker: : Abhi Pratap

Course:
The lecture provides an overview of the core skills and practical solutions required to practice reproducible research.
Difficulty level: Beginner
Duration: 1:25:17
Speaker: : Fernando Perez

Learn how to create a standard extracellular electrophysiology dataset in NWB using Python.
Difficulty level: Intermediate
Duration: 23:10
Speaker: : Ryan Ly