Lesson type
Difficulty level

Course:
This lesson gives an introduction to high-performance computing with the Compute Canada network, first providing an overview of use cases for HPC and then a hands-on tutorial. Though some examples might seem specific to the Calcul Québec, all computing clusters in the Compute Canada network share the same software modules and environments.
Difficulty level: Beginner
Duration: 02:49:34
Speaker: : Félix-Antoine Fortin

Course:
This lecture covers FAIR atlases, including their background and construction, as well as how they can be created in line with the FAIR principles.
Difficulty level: Beginner
Duration: 14:24
Speaker: : Heidi Kleven

Course:
This hands-on tutorial explains how to run your own Minion session in the MetaCell cloud using jupityr notebooks.
Difficulty level: Beginner
Duration: 01:28:03
Speaker: : Daniel Aharoni, Phil Dong

Course:
This lesson describes the principles underlying functional magnetic resonance imaging (fMRI), diffusion-weighted imaging (DWI), tractography, and parcellation. These tools and concepts are explained in a broader context of neural connectivity and mental health.
Difficulty level: Intermediate
Duration: 1:47:22
Speaker: : Erin Dickie and John Griffiths

In this hands-on session, you will learn how to explore and work with DataLad datasets, containers, and structures using Jupyter notebooks.
Difficulty level: Beginner
Duration: 58:05
Speaker: : Michał Szczepanik

This lesson explores how researchers try to understand neural networks, particularly in the case of observing neural activity.
Difficulty level: Intermediate
Duration: 8:20
Speaker: : Marcus Ghosh
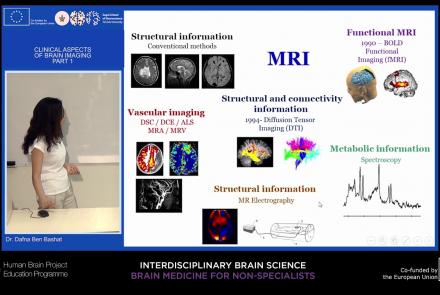
This lecture will provide an overview of neuroimaging techniques and their clinical applications.
Difficulty level: Beginner
Duration: 45:29
Speaker: : Dafna Ben Bashat

This lecture provides an introduction to the Brain Imaging Data Structure (BIDS), a standard for organizing human neuroimaging datasets.
Difficulty level: Intermediate
Duration: 56:49
Speaker: : Chris Gorgolewski

Course:
This lecture presents an overview of functional brain parcellations, as well as a set of tutorials on bootstrap agregation of stable clusters (BASC) for fMRI brain parcellation.
Difficulty level: Advanced
Duration: 50:28
Speaker: : Pierre Bellec
Course:
This lecture covers the needs and challenges involved in creating a FAIR ecosystem for neuroimaging research.
Difficulty level: Beginner
Duration: 12:26
Speaker: : Camille Maumet

This lecture covers the NIDM data format within BIDS to make your datasets more searchable, and how to optimize your dataset searches.
Difficulty level: Beginner
Duration: 12:33
Speaker: : David Keator
This lecture covers the processes, benefits, and challenges involved in designing, collecting, and sharing FAIR neuroscience datasets.
Difficulty level: Beginner
Duration: 11:35
Speaker: : Julie Boyle & Valentina Borghesani
This lecture covers positron emission tomography (PET) imaging and the Brain Imaging Data Structure (BIDS), and how they work together within the PET-BIDS standard to make neuroscience more open and FAIR.
Difficulty level: Beginner
Duration: 12:06
Speaker: : Melanie Ganz
This lecture covers the benefits and difficulties involved when re-using open datasets, and how metadata is important to the process.
Difficulty level: Beginner
Duration: 11:20
Speaker: : Elizabeth DuPre
This lecture provides guidance on the ethical considerations the clinical neuroimaging community faces when applying the FAIR principles to their research.
Difficulty level: Beginner
Duration: 13:11
Speaker: : Gustav Nilsonne

Course:
An introduction to data management, manipulation, visualization, and analysis for neuroscience. Students will learn scientific programming in Python, and use this to work with example data from areas such as cognitive-behavioral research, single-cell recording, EEG, and structural and functional MRI. Basic signal processing techniques including filtering are covered. The course includes a Jupyter Notebook and video tutorials.
Difficulty level: Beginner
Duration: 1:09:16
Speaker: : Aaron J. Newman
Course:
This book was written with the goal of introducing researchers and students in a variety of research fields to the intersection of data science and neuroimaging. This book reflects our own experience of doing research at the intersection of data science and neuroimaging and it is based on our experience working with students and collaborators who come from a variety of backgrounds and have a variety of reasons for wanting to use data science approaches in their work. The tools and ideas that we chose to write about are all tools and ideas that we have used in some way in our own research. Many of them are tools that we use on a daily basis in our work. This was important to us for a few reasons: the first is that we want to teach people things that we ourselves find useful. Second, it allowed us to write the book with a focus on solving specific analysis tasks. For example, in many of the chapters you will see that we walk you through ideas while implementing them in code, and with data. We believe that this is a good way to learn about data analysis, because it provides a connecting thread from scientific questions through the data and its representation to implementing specific answers to these questions. Finally, we find these ideas compelling and fruitful. That’s why we were drawn to them in the first place. We hope that our enthusiasm about the ideas and tools described in this book will be infectious enough to convince the readers of their value.
Difficulty level: Intermediate
Duration:
Speaker: :
Course:
This Jupyter Book is a series of interactive tutorials about quantitative T1 mapping, powered by qMRLab. Most figures are generated with Plot.ly – you can play with them by hovering your mouse over the data, zooming in (click and drag) and out (double click), moving the sliders, and changing the drop-down options. To view the code that was used to generate the figures in this blog post, hover your cursor in the top left corner of the frame that contains the tutorial and click the checkbox “All cells” in the popup that appears.
Jupyter Lab notebooks of these tutorials are also available through MyBinder, and inline code modification inside the Jupyter Book is provided by Thebelab. For both options, you can modify the code, change the figures, and regenerate the html that was used to create the tutorial below. This Jupyter Book also uses a Script of Scripts (SoS) kernel, allowing us to process the data using qMRLab in MATLAB/Octave and plot the figures with Plot.ly using Python, all within the same Jupyter Notebook.
Difficulty level: Intermediate
Duration:
Speaker: :

This video provides a very quick introduction to some of the neuromorphic sensing devices, and how they offer unique, low-power applications.
Difficulty level: Intermediate
Duration: 2:37
Speaker: : Dan Goodman

Course:
This module covers a brief history of the neurotechnology industry, bringing the history of brain-computer interfacing to life through engaging skits and stories.
Difficulty level: Beginner
Duration: 12:53
Speaker: : Colin Fausnaught