Lesson type
Difficulty level

Course:
This lesson introduces the EEGLAB toolbox, as well as motivations for its use.
Difficulty level: Beginner
Duration: 15:32
Speaker: : Arnaud Delorme
Course:
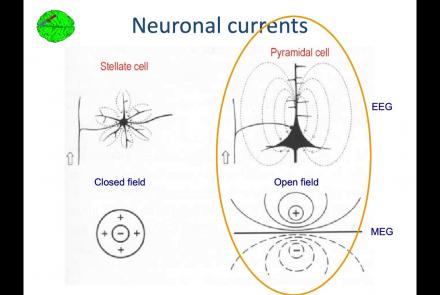
In this lesson, you will learn about the biological activity which generates and is measured by the EEG signal.
Difficulty level: Beginner
Duration: 6:53
Speaker: : Arnaud Delorme

Course:
This lesson goes over the characteristics of EEG signals when analyzed in source space (as opposed to sensor space).
Difficulty level: Beginner
Duration: 10:56
Speaker: : Arnaud Delorme

Course:
This lesson describes the development of EEGLAB as well as to what extent it is used by the research community.
Difficulty level: Beginner
Duration: 6:06
Speaker: : Arnaud Delorme

Course:
This lesson provides instruction as to how to build a processing pipeline in EEGLAB for a single participant.
Difficulty level: Beginner
Duration: 9:20
Speaker: :

Course:
Whereas the previous lesson of this course outlined how to build a processing pipeline for a single participant, this lesson discusses analysis pipelines for multiple participants simultaneously.
Difficulty level: Beginner
Duration: 10:55
Speaker: : Arnaud Delorme

Course:
In addition to outlining the motivations behind preprocessing EEG data in general, this lesson covers the first step in preprocessing data with EEGLAB, importing raw data.
Difficulty level: Beginner
Duration: 8:30
Speaker: : Arnaud Delorme

Course:
Continuing along the EEGLAB preprocessing pipeline, this tutorial walks users through how to import data events as well as EEG channel locations.
Difficulty level: Beginner
Duration: 11:53
Speaker: : Arnaud Delorme

Course:
This tutorial demonstrates how to re-reference and resample raw data in EEGLAB, why such steps are important or useful in the preprocessing pipeline, and how choices made at this step may affect subsequent analyses.
Difficulty level: Beginner
Duration: 11:48
Speaker: : Arnaud Delorme

Course:
In this tutorial, users learn about the various filtering options in EEGLAB, how to inspect channel properties for noisy signals, as well as how to filter out specific components of EEG data (e.g., electrical line noise).
Difficulty level: Beginner
Duration: 10:46
Speaker: : Arnaud Delorme

Course:
This tutorial instructs users how to visually inspect partially pre-processed neuroimaging data in EEGLAB, specifically how to use the data browser to investigate specific channels, epochs, or events for removable artifacts, biological (e.g., eye blinks, muscle movements, heartbeat) or otherwise (e.g., corrupt channel, line noise).
Difficulty level: Beginner
Duration: 5:08
Speaker: : Arnaud Delorme

Course:
This tutorial provides instruction on how to use EEGLAB to further preprocess EEG datasets by identifying and discarding bad channels which, if left unaddressed, can corrupt and confound subsequent analysis steps.
Difficulty level: Beginner
Duration: 13:01
Speaker: : Arnaud Delorme

Course:
Users following this tutorial will learn how to identify and discard bad EEG data segments using the MATLAB toolbox EEGLAB.
Difficulty level: Beginner
Duration: 11:25
Speaker: : Arnaud Delorme

This lecture gives an overview of how to prepare and preprocess neuroimaging (EEG/MEG) data for use in TVB.
Difficulty level: Intermediate
Duration: 1:40:52
Speaker: : Paul Triebkorn

Course:
This module covers many of the types of non-invasive neurotech and neuroimaging devices including electroencephalography (EEG), electromyography (EMG), electroneurography (ENG), magnetoencephalography (MEG), and more.
Difficulty level: Beginner
Duration: 13:36
Speaker: : Harrison Canning
Hierarchical Event Descriptors (HED) fill a major gap in the neuroinformatics standards toolkit, namely the specification of the nature(s) of events and time-limited conditions recorded as having occurred during time series recordings (EEG, MEG, iEEG, fMRI, etc.). Here, the HED Working Group presents an online INCF workshop on the need for, structure of, tools for, and use of HED annotation to prepare neuroimaging time series data for storing, sharing, and advanced analysis.
Difficulty level: Beginner
Duration: 03:37:42
Speaker: :

This brief talk goes into work being done at The Alan Turing Institute to solve real-world challenges and democratize computer vision methods to support interdisciplinary and international researchers.
Difficulty level: Beginner
Duration: 7:10
Speaker: : Alden Connor & Beatriz Costa Gomes
Course:
This book was written with the goal of introducing researchers and students in a variety of research fields to the intersection of data science and neuroimaging. This book reflects our own experience of doing research at the intersection of data science and neuroimaging and it is based on our experience working with students and collaborators who come from a variety of backgrounds and have a variety of reasons for wanting to use data science approaches in their work. The tools and ideas that we chose to write about are all tools and ideas that we have used in some way in our own research. Many of them are tools that we use on a daily basis in our work. This was important to us for a few reasons: the first is that we want to teach people things that we ourselves find useful. Second, it allowed us to write the book with a focus on solving specific analysis tasks. For example, in many of the chapters you will see that we walk you through ideas while implementing them in code, and with data. We believe that this is a good way to learn about data analysis, because it provides a connecting thread from scientific questions through the data and its representation to implementing specific answers to these questions. Finally, we find these ideas compelling and fruitful. That’s why we were drawn to them in the first place. We hope that our enthusiasm about the ideas and tools described in this book will be infectious enough to convince the readers of their value.
Difficulty level: Intermediate
Duration:
Speaker: :

This short talk addresses how to use VisuAlign to make nonlinear adjustments to 2D-to-3D registrations generated by QuickNII.
Difficulty level: Beginner
Duration: 08:50
Speaker: : Maja Puchades

This talk aims to provide guidance regarding the myriad labelling methods for histological image data.
Difficulty level: Beginner
Duration: 35:20
Speaker: : Sharon Yates