Lesson type
Difficulty level

Manipulate the default connectome provided with TVB to see how structural lesions effect brain dynamics. In this hands-on session you will insert lesions into the connectome within the TVB graphical user interface (GUI). Afterwards, the modified connectome will be used for simulations and the resulting activity will be analysed using functional connectivity.
Difficulty level: Beginner
Duration: 31:22
Speaker: : Paul Triebkorn

This presentation discusses the impact of data sharing in stroke.
Difficulty level: Intermediate
Duration: 16:33
Speaker: : Valeria Caso

This talks presents an overview of the potential for data federation in stroke research.
Difficulty level: Intermediate
Duration: 21:37
Speaker: : Maurizio A. Leone

Course:
This talk focuses on the EAN Scientific Panel of Stroke, in particular on the aims and roles of the panel.
Difficulty level: Intermediate
Duration: 18:19
Speaker: : Anna Bersano

Course:
The Mouse Phenome Database (MPD) provides access to primary experimental trait data, genotypic variation, protocols and analysis tools for mouse genetic studies. Data are contributed by investigators worldwide and represent a broad scope of phenotyping endpoints and disease-related traits in naïve mice and those exposed to drugs, environmental agents or other treatments. MPD ensures rigorous curation of phenotype data and supporting documentation using relevant ontologies and controlled vocabularies. As a repository of curated and integrated data, MPD provides a means to access/re-use baseline data, as well as allows users to identify sensitized backgrounds for making new mouse models with genome editing technologies, analyze trait co-inheritance, benchmark assays in their own laboratories, and many other research applications. MPD’s primary source of funding is NIDA. For this reason, a majority of MPD data is neuro- and behavior-related.
Difficulty level: Beginner
Duration: 55:36
Speaker: : Elissa Chesler

Course:
This lesson is a general overview of overarching concepts in neuroinformatics research, with a particular focus on clinical approaches to defining, measuring, studying, diagnosing, and treating various brain disorders. Also described are the complex, multi-level nature of brain disorders and the data associated with them, from genes and individual cells up to cortical microcircuits and whole-brain network dynamics. Given the heterogeneity of brain disorders and their underlying mechanisms, this lesson lays out a case for multiscale neuroscience data integration.
Difficulty level: Intermediate
Duration: 1:09:33
Speaker: : Sean Hill

This lesson gives an in-depth introduction of ethics in the field of artificial intelligence, particularly in the context of its impact on humans and public interest. As the healthcare sector becomes increasingly affected by the implementation of ever stronger AI algorithms, this lecture covers key interests which must be protected going forward, including privacy, consent, human autonomy, inclusiveness, and equity.
Difficulty level: Beginner
Duration: 1:22:06
Speaker: : Daniel Buchman

This is a continuation of the talk on the cellular mechanisms of neuronal communication, this time at the level of brain microcircuits and associated global signals like those measureable by electroencephalography (EEG). This lecture also discusses EEG biomarkers in mental health disorders, and how those cortical signatures may be simulated digitally.
Difficulty level: Intermediate
Duration: 1:11:04
Speaker: : Etay Hay

This is the second of three lectures around current challenges and opportunities facing neuroinformatic infrastructure for handling sensitive data.
Difficulty level: Beginner
Duration: 48:26
Speaker: : Michael Schirner

In this lesson you will learn about current efforts towards integrating multimodal human brain data using the open source SCORE HED library schema.
Difficulty level: Beginner
Duration: 23:29
Speaker: : Dora Hermes

This lecture aims to help researchers, students, and health care professionals understand the place for neuroinformatics in the patient journey using the exemplar of an epilepsy patient.
Difficulty level: Intermediate
Duration: 1:32:53
Speaker: : Randy Gollub & Prantik Kundu
The lesson introduces the Brain Imaging Data Structure (BIDS), the community standard for organizing, curating, and sharing neuroimaging and associated data. The session focuses on understanding the BIDS framework, learning its data structure and validation processes.
Difficulty level: Intermediate
Duration: 38:52
Speaker: : Cyril Pernet
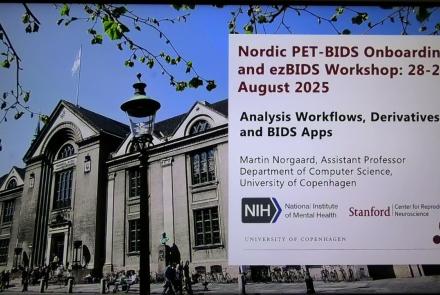
This session moves from BIDS basics into analysis workflows, focusing on how to turn raw, BIDS-organized data into derivatives using BIDS Apps and containers for reproducible processing. It compares end-to-end pipelines across fMRI and PET (and notes EEG/MEG), explains typical preprocessing choices, and shows how standardized inputs plus containerized tools (Docker/AppTainer) yield consistent, auditable outputs.
Difficulty level: Intermediate
Duration: 56:03
Speaker: : Martin Nørgaard
The session explains GDPR rules around data sharing for research in Europe, the distinction between law and ethics, and introduces practical solutions for securely sharing sensitive datasets. Researchers have more flexibility than commonly assumed: scientific research is considered a public interest task, so explicit consent for data sharing isn’t legally required, though transparency and informing participants remain ethically important. The talk also introduces publicneuro.eu, a controlled-access platform that enables sharing neuroimaging datasets with open metadata, DOIs, and customizable access restrictions while ensuring GDPR compliance.
Difficulty level: Intermediate
Duration: 31:12
Speaker: : Cyril Pernet
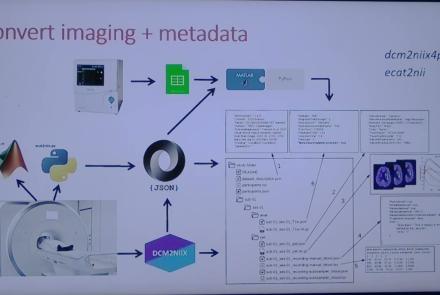
This session introduces the PET-to-BIDS (PET2BIDS) library, a toolkit designed to simplify the conversion and preparation of PET imaging datasets into BIDS-compliant formats. It supports multiple data types and formats (e.g., DICOM, ECAT7+, nifti, JSON), integrates seamlessly with Excel-based metadata, and provides automated routines for metadata updates, blood data conversion, and JSON synchronization. PET2BIDS improves human readability by mapping complex reconstruction names into standardized, descriptive labels and offers extensive documentation, examples, and video tutorials to make adoption easier for researchers.
Difficulty level: Intermediate
Duration: 9:23
Speaker: : Cyril Pernet
This session introduces the PET-to-BIDS (PET2BIDS) library, a toolkit designed to simplify the conversion and preparation of PET imaging datasets into BIDS-compliant formats. It supports multiple data types and formats (e.g., DICOM, ECAT7+, nifti, JSON), integrates seamlessly with Excel-based metadata, and provides automated routines for metadata updates, blood data conversion, and JSON synchronization. PET2BIDS improves human readability by mapping complex reconstruction names into standardized, descriptive labels and offers extensive documentation, examples, and video tutorials to make adoption easier for researchers.
Difficulty level: Intermediate
Duration: 41:04
Speaker: : Martin Nørgaard
This session dives into practical PET tooling on BIDS data—showing how to run motion correction, register PET↔MRI, extract time–activity curves, and generate standardized PET-BIDS derivatives with clear QC reports. It introduces modular BIDS Apps (head-motion correction, TAC extraction), a full pipeline (PETPrep), and a PET/MRI defacer, with guidance on parameters, outputs, provenance, and why Dockerized containers are the reliable way to run them at scale.
Difficulty level: Intermediate
Duration: 1:05:38
Speaker: : Martin Nørgaard
This session introduces two PET quantification tools—bloodstream for processing arterial blood data and kinfitr for kinetic modeling and quantification—built to work with BIDS/BIDS-derivatives and containers. Bloodstream fuses autosampler and manual measurements (whole blood, plasma, parent fraction) using interpolation or fitted models (incl. hierarchical GAMs) to produce a clean arterial input function (AIF) and whole-blood curves with rich QC reports ready. TAC data (e.g., from PETPrep) and blood (e.g., from bloodstream) can be ingested using kinfitr to run reproducible, GUI-driven analyses: define combined ROIs, calculate weighting factors, estimate blood–tissue delay, choose and chain models (e.g., 2TCM → 1TCM with parameter inheritance), and export parameters/diagnostics. Both are available as Docker apps; workflows emphasize configuration files, reports, and standard outputs to support transparency and reuse.
Difficulty level: Intermediate
Duration: 1:20:56
Speaker: : Granville Matheson

This lecture will highlight our current understanding and recent developments in the field of neurodegenerative disease research, as well as the future of diagnostics and treatment of neurodegenerative diseases.
Difficulty level: Beginner
Duration: 39:05
Speaker: : Nir Giladi

This lecture continues from part one (previous lesson), highlighting our current understanding and recent developments in the field of neurodegenerative disease research, as well as the future of diagnostics and treatment of neurodegenerative diseases.
Difficulty level: Beginner
Duration: 45:27
Speaker: : Nir Giladi