Lesson type
Difficulty level

This hands-on tutorial walks you through DataJoint platform, highlighting features and schema which can be used to build robost neuroscientific pipelines.
Difficulty level: Beginner
Duration: 26:06
Speaker: : Milagros Marin

In this third and final hands-on tutorial from the Research Workflows for Collaborative Neuroscience workshop, you will learn about workflow orchestration using open source tools like DataJoint and Flyte.
Difficulty level: Intermediate
Duration: 22:36
Speaker: : Daniel Xenes
Course:
This lesson gives an introductory presentation on how data science can help with scientific reproducibility.
Difficulty level: Beginner
Duration:
Speaker: : Michel Dumontier

This lecture covers the application of diffusion MRI for clinical and preclinical studies.
Difficulty level: Beginner
Duration: 33:10
Speaker: : Silvia de Santis

Course:
This tutorial introduces pipelines and methods to compute brain connectomes from fMRI data. With corresponding code and repositories, participants can follow along and learn how to programmatically preprocess, curate, and analyze functional and structural brain data to produce connectivity matrices.
Difficulty level: Intermediate
Duration: 1:39:04
Speaker: : Erin Dickie and John Griffiths
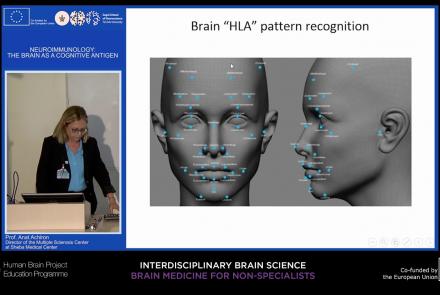
This lecture focuses on how the immune system can target and attack the nervous system to produce autoimmune responses that may result in diseases such as multiple sclerosis, neuromyelitis, and lupus cerebritis manifested by motor, sensory, and cognitive impairments. Despite the fact that the brain is an immune-privileged site, autoreactive lymphocytes producing proinflammatory cytokines can cause active brain inflammation, leading to myelin and axonal loss.
Difficulty level: Beginner
Duration: 37:36
Speaker: : Anat Achiron

This lesson delves into the the structure of one of the brain's most elemental computational units, the neuron, and how said structure influences computational neural network models.
Difficulty level: Intermediate
Duration: 6:33
Speaker: : Marcus Ghosh

This lesson goes over the basic mechanisms of neural synapses, the space between neurons where signals may be transmitted.
Difficulty level: Intermediate
Duration: 7:03
Speaker: : Marcus Ghosh

While the previous lesson in the Neuro4ML course dealt with the mechanisms involved in individual synapses, this lesson discusses how synapses and their neurons' firing patterns may change over time.
Difficulty level: Intermediate
Duration: 4:48
Speaker: : Marcus Ghosh

Whereas the previous two lessons described the biophysical and signalling properties of individual neurons, this lesson describes properties of those units when part of larger networks.
Difficulty level: Intermediate
Duration: 6:00
Speaker: : Marcus Ghosh

This lesson continues with the second workshop on reproducible science, focusing on additional open source tools for researchers and data scientists, such as the R programming language for data science, as well as associated tools like RStudio and R Markdown. Additionally, users are introduced to Python and iPython notebooks, Google Colab, and are given hands-on tutorials on how to create a Binder environment, as well as various containers in Docker and Singularity.
Difficulty level: Beginner
Duration: 1:16:04
Speaker: : Erin Dickie and Sejal Patel

This lesson contains both a lecture and a tutorial component. The lecture (0:00-20:03 of YouTube video) discusses both the need for intersectional approaches in healthcare as well as the impact of neglecting intersectionality in patient populations. The lecture is followed by a practical tutorial in both Python and R on how to assess intersectional bias in datasets. Links to relevant code and data are found below.
Difficulty level: Beginner
Duration: 52:26

This is a hands-on tutorial on PLINK, the open source whole genome association analysis toolset. The aims of this tutorial are to teach users how to perform basic quality control on genetic datasets, as well as to identify and understand GWAS summary statistics.
Difficulty level: Intermediate
Duration: 1:27:18
Speaker: : Dan Felsky

This is a tutorial on using the open-source software PRSice to calculate a set of polygenic risk scores (PRS) for a study sample. Users will also learn how to read PRS into R, visualize distributions, and perform basic association analyses.
Difficulty level: Intermediate
Duration: 1:53:34
Speaker: : Dan Felsky

This lesson is an overview of transcriptomics, from fundamental concepts of the central dogma and RNA sequencing at the single-cell level, to how genetic expression underlies diversity in cell phenotypes.
Difficulty level: Intermediate
Duration: 1:29:08
Speaker: : Shreejoy Tripathy

This is a tutorial introducing participants to the basics of RNA-sequencing data and how to analyze its features using Seurat.
Difficulty level: Intermediate
Duration: 1:19:17
Speaker: : Sonny Chen

This tutorial demonstrates how to perform cell-type deconvolution in order to estimate how proportions of cell-types in the brain change in response to various conditions. While these techniques may be useful in addressing a wide range of scientific questions, this tutorial will focus on the cellular changes associated with major depression (MDD).
Difficulty level: Intermediate
Duration: 1:15:14
Speaker: : Keon Arbabi

This is a tutorial on how to simulate neuronal spiking in brain microcircuit models, as well as how to analyze, plot, and visualize the corresponding data.
Difficulty level: Intermediate
Duration: 1:39:50
Speaker: : Frank Mazza

In this hands-on session, you will learn how to explore and work with DataLad datasets, containers, and structures using Jupyter notebooks.
Difficulty level: Beginner
Duration: 58:05
Speaker: : Michał Szczepanik

Course:
This video will document the process of creating a pipeline rule for batch processing on brainlife.
Difficulty level: Intermediate
Duration: 0:57
Speaker: :