Lesson type
Difficulty level

Course:
This tutorial demonstrates how to work with neuronal data using MATLAB, including actional potentials and spike counts, orientation tuing curves in visual cortex, and spatial maps of firing rates.
Difficulty level: Intermediate
Duration: 5:17
Speaker: : Mike X. Cohen

Course:
This lesson instructs users on how to import electrophysiological neural data into MATLAB, as well as how to convert spikes to a data matrix.
Difficulty level: Intermediate
Duration: 11:37
Speaker: : Mike X. Cohen

Course:
In this lesson, users will learn how to appropriately sort and bin neural spikes, allowing for the generation of a common and powerful visualization tool in neuroscience, the histogram.
Difficulty level: Intermediate
Duration: 5:31
Speaker: : Mike X. Cohen

Course:
Followers of this lesson will learn how to compute, visualize and quantify the tuning curves of individual neurons.
Difficulty level: Intermediate
Duration: 13:48
Speaker: : Mike X. Cohen

Course:
This lesson demonstrates how to programmatically generate a spatial map of neuronal spike counts using MATLAB.
Difficulty level: Intermediate
Duration: 12:16
Speaker: : Mike X. Cohen

Course:
In this lesson, users are shown how to create a spatial map of neuronal orientation tuning.
Difficulty level: Intermediate
Duration: 13:11
Speaker: : Mike X. Cohen

This lesson introduces some practical exercises which accompany the Synapses and Networks portion of this Neuroscience for Machine Learners course.
Difficulty level: Intermediate
Duration: 3:51
Speaker: : Dan Goodman
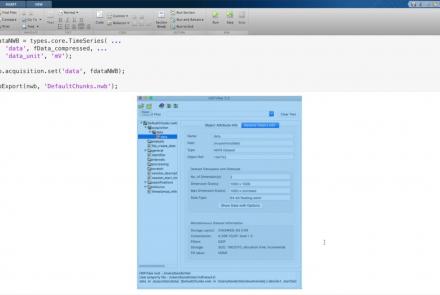
This lesson provides a tutorial on how to handle writing very large data in MatNWB.
Difficulty level: Advanced
Duration: 16:18
Speaker: : Ben Dichter

This lesson provides an overview of the CaImAn package, as well as a demonstration of usage with NWB.
Difficulty level: Intermediate
Duration: 44:37
Speaker: : Andrea Giovannucci

This lesson gives an overview of the SpikeInterface package, including demonstration of data loading, preprocessing, spike sorting, and comparison of spike sorters.
Difficulty level: Intermediate
Duration: 1:10:28
Speaker: : Alessio Buccino

In this lesson, users will learn about the NWBWidgets package, including coverage of different data types, and information for building custom widgets within this framework.
Difficulty level: Intermediate
Duration: 47:15
Speaker: : Ben Dichter