Lesson type
Difficulty level

This lesson continues with the second workshop on reproducible science, focusing on additional open source tools for researchers and data scientists, such as the R programming language for data science, as well as associated tools like RStudio and R Markdown. Additionally, users are introduced to Python and iPython notebooks, Google Colab, and are given hands-on tutorials on how to create a Binder environment, as well as various containers in Docker and Singularity.
Difficulty level: Beginner
Duration: 1:16:04
Speaker: : Erin Dickie and Sejal Patel

This hands-on tutorial walks you through DataJoint platform, highlighting features and schema which can be used to build robost neuroscientific pipelines.
Difficulty level: Beginner
Duration: 26:06
Speaker: : Milagros Marin

In this hands-on session, you will learn how to explore and work with DataLad datasets, containers, and structures using Jupyter notebooks.
Difficulty level: Beginner
Duration: 58:05
Speaker: : Michał Szczepanik

Course:
This video will document the process of uploading data into a brainlife project using ezBIDS.
Difficulty level: Beginner
Duration: 6:15
Speaker: :

Course:
This short video walks you through the steps of publishing a dataset on brainlife, an open-source, free and secure reproducible neuroscience analysis platform.
Difficulty level: Beginner
Duration: 1:18
Speaker: :
Course:
This video will document the process of visualizing the provenance of each step performed to generate a data object on brainlife.
Difficulty level: Beginner
Duration: 0:21
Speaker: :

Course:
This video will document the process of downloading and running the "reproduce.sh" script, which will automatically run all of the steps to generate a data object locally on a user's machine.
Difficulty level: Beginner
Duration: 3:44
Speaker: :

Course:
This video will document how to run a correlation analysis between the gray matter volume of two different structures using the output from brainlife app-freesurfer-stats.
Difficulty level: Beginner
Duration: 1:33
Speaker: :

Course:
This short video shows how a brainlife.io publication can be opened from the Data Deposition page of the journal Nature Scientific Data.
Difficulty level: Beginner
Duration: 2:25
Speaker: :

Course:
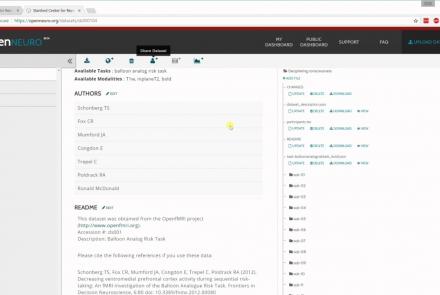
In this tutorial, you will learn the basic features of uploading and versioning your data within OpenNeuro.org.
Difficulty level: Beginner
Duration: 5:36
Speaker: : OpenNeuro
Course:
This tutorial shows how to share your data in OpenNeuro.org.
Difficulty level: Beginner
Duration: 1:22
Speaker: : OpenNeuro

Course:
Following the previous two tutorials on uploading and sharing data with OpenNeuro.org, this tutorial briefly covers how to run various analyses on your datasets.
Difficulty level: Beginner
Duration: 2:26
Speaker: : OpenNeuro

Course:
This tutorial is part 1 of 2. It aims to provide viewers with an understanding of the fundamentals of R tool. Note: parts 1 and 2 of this tutorial are part of the same YouTube video; part 1 ends at 17:42.
Difficulty level: Beginner
Duration: 17:42
Speaker: : Edureka

Course:
In this lesson you will learn how to simulate seizure events and epilepsy in The Virtual Brain. We will look at the paper On the Nature of Seizure Dynamics, which describes a new local model called the Epileptor, and apply this same model in The Virtual Brain. This is part 1 of 2 in a series explaining how to use the Epileptor. In this part, we focus on setting up the parameters.
Difficulty level: Beginner
Duration: 4:44
Speaker: : Paul Triebkorn

Research Resource Identifiers (RRIDs) are ID numbers assigned to help researchers cite key resources (e.g., antibodies, model organisms, and software projects) in biomedical literature to improve the transparency of research methods.
Difficulty level: Beginner
Duration: 1:01:36
Speaker: : Maryann Martone

Course:
The Mouse Phenome Database (MPD) provides access to primary experimental trait data, genotypic variation, protocols and analysis tools for mouse genetic studies. Data are contributed by investigators worldwide and represent a broad scope of phenotyping endpoints and disease-related traits in naïve mice and those exposed to drugs, environmental agents or other treatments. MPD ensures rigorous curation of phenotype data and supporting documentation using relevant ontologies and controlled vocabularies. As a repository of curated and integrated data, MPD provides a means to access/re-use baseline data, as well as allows users to identify sensitized backgrounds for making new mouse models with genome editing technologies, analyze trait co-inheritance, benchmark assays in their own laboratories, and many other research applications. MPD’s primary source of funding is NIDA. For this reason, a majority of MPD data is neuro- and behavior-related.
Difficulty level: Beginner
Duration: 55:36
Speaker: : Elissa Chesler

Course:
This demonstration walks through how to import your data into MATLAB.
Difficulty level: Beginner
Duration: 6:10
Speaker: : MATLAB®

Course:
This lesson provides instruction regarding the various factors one must consider when preprocessing data, preparing it for statistical exploration and analyses.
Difficulty level: Beginner
Duration: 15:10
Speaker: : MATLAB®

Course:
This tutorial outlines, step by step, how to perform analysis by group and how to do change-point detection.
Difficulty level: Beginner
Duration: 2:49
Speaker: : MATLAB®

Course:
This tutorial walks through several common methods for visualizing your data in different ways depending on your data type.
Difficulty level: Beginner
Duration: 6:10
Speaker: : MATLAB®