Lesson type
Difficulty level

Course:
This tutorial demonstrates how to work with neuronal data using MATLAB, including actional potentials and spike counts, orientation tuing curves in visual cortex, and spatial maps of firing rates.
Difficulty level: Intermediate
Duration: 5:17
Speaker: : Mike X. Cohen

Course:
This lesson instructs users on how to import electrophysiological neural data into MATLAB, as well as how to convert spikes to a data matrix.
Difficulty level: Intermediate
Duration: 11:37
Speaker: : Mike X. Cohen

Course:
In this lesson, users will learn how to appropriately sort and bin neural spikes, allowing for the generation of a common and powerful visualization tool in neuroscience, the histogram.
Difficulty level: Intermediate
Duration: 5:31
Speaker: : Mike X. Cohen

Course:
Followers of this lesson will learn how to compute, visualize and quantify the tuning curves of individual neurons.
Difficulty level: Intermediate
Duration: 13:48
Speaker: : Mike X. Cohen

Course:
This lesson demonstrates how to programmatically generate a spatial map of neuronal spike counts using MATLAB.
Difficulty level: Intermediate
Duration: 12:16
Speaker: : Mike X. Cohen

Course:
In this lesson, users are shown how to create a spatial map of neuronal orientation tuning.
Difficulty level: Intermediate
Duration: 13:11
Speaker: : Mike X. Cohen

This is a hands-on tutorial on PLINK, the open source whole genome association analysis toolset. The aims of this tutorial are to teach users how to perform basic quality control on genetic datasets, as well as to identify and understand GWAS summary statistics.
Difficulty level: Intermediate
Duration: 1:27:18
Speaker: : Dan Felsky

In this third and final hands-on tutorial from the Research Workflows for Collaborative Neuroscience workshop, you will learn about workflow orchestration using open source tools like DataJoint and Flyte.
Difficulty level: Intermediate
Duration: 22:36
Speaker: : Daniel Xenes

This lecture describes how to build research workflows, including a demonstrate using DataJoint Elements to build data pipelines.
Difficulty level: Intermediate
Duration: 47:00
Speaker: : Dimitri Yatsenko

Course:
This video will document the process of creating a pipeline rule for batch processing on brainlife.
Difficulty level: Intermediate
Duration: 0:57
Speaker: :

Following the previous lesson on neuronal structure, this lesson discusses neuronal function, particularly focusing on spike triggering and propogation.
Difficulty level: Intermediate
Duration: 6:58
Speaker: : Marcus Ghosh

This lesson introduces some practical exercises which accompany the Synapses and Networks portion of this Neuroscience for Machine Learners course.
Difficulty level: Intermediate
Duration: 3:51
Speaker: : Dan Goodman

Explore how to setup an epileptic seizure simulation with the TVB graphical user interface. This lesson will show you how to program the epileptor model in the brain network to simulate a epileptic seizure originating in the hippocampus. It will also show how to upload and view mouse connectivity data, as well as give a short introduction to the python script interface of TVB.
Difficulty level: Intermediate
Duration: 58:06
Speaker: : Paul Triebkorn

This lesson describes how DataLad allows you to track and mange both your data and analysis code, thereby facilitating reliable, reproducible, and shareable research.
Difficulty level: Intermediate
Duration: 59:34
Speaker: : Yaroslav O. Halchenko

This tutorial provides instruction on how to simulate brain tumors with TVB (reproducing publication: Marinazzo et al. 2020 Neuroimage). This tutorial comprises a didactic video, jupyter notebooks, and full data set for the construction of virtual brains from patients and health controls.
Difficulty level: Intermediate
Duration: 10:01

The tutorial on modelling strokes in TVB includes a didactic video and jupyter notebooks (reproducing publication: Falcon et al. 2016 eNeuro).
Difficulty level: Intermediate
Duration: 7:43
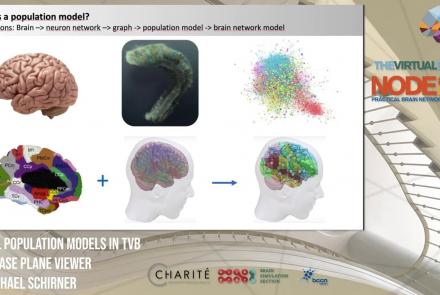
This lesson introduces population models and the phase plane, and is part of the The Virtual Brain (TVB) Node 10 Series, a 4-day workshop dedicated to learning about the full brain simulation platform TVB, as well as brain imaging, brain simulation, personalised brain models, and TVB use cases.
Difficulty level: Intermediate
Duration: 1:10:41
Speaker: : Michael Schirner

In this tutorial, you will learn how to run a typical TVB simulation.
Difficulty level: Intermediate
Duration: 1:29:13
Speaker: : Paul Triebkorn

This lesson introduces TVB-multi-scale extensions and other TVB tools which facilitate modeling and analyses of multi-scale data.
Difficulty level: Intermediate
Duration: 36:10
Speaker: : Dionysios Perdikis

This tutorial introduces The Virtual Mouse Brain (TVMB), walking users through the necessary steps for performing simulation operations on animal brain data.
Difficulty level: Intermediate
Duration: 42:43
Speaker: : Patrik Bey