Lesson type
Difficulty level

Manipulate the default connectome provided with TVB to see how structural lesions effect brain dynamics. In this hands-on session you will insert lesions into the connectome within the TVB graphical user interface (GUI). Afterwards, the modified connectome will be used for simulations and the resulting activity will be analysed using functional connectivity.
Difficulty level: Beginner
Duration: 31:22
Speaker: : Paul Triebkorn

This presentation discusses the impact of data sharing in stroke.
Difficulty level: Intermediate
Duration: 16:33
Speaker: : Valeria Caso

This talks presents an overview of the potential for data federation in stroke research.
Difficulty level: Intermediate
Duration: 21:37
Speaker: : Maurizio A. Leone

Course:
This talk focuses on the EAN Scientific Panel of Stroke, in particular on the aims and roles of the panel.
Difficulty level: Intermediate
Duration: 18:19
Speaker: : Anna Bersano

Course:
The Mouse Phenome Database (MPD) provides access to primary experimental trait data, genotypic variation, protocols and analysis tools for mouse genetic studies. Data are contributed by investigators worldwide and represent a broad scope of phenotyping endpoints and disease-related traits in naïve mice and those exposed to drugs, environmental agents or other treatments. MPD ensures rigorous curation of phenotype data and supporting documentation using relevant ontologies and controlled vocabularies. As a repository of curated and integrated data, MPD provides a means to access/re-use baseline data, as well as allows users to identify sensitized backgrounds for making new mouse models with genome editing technologies, analyze trait co-inheritance, benchmark assays in their own laboratories, and many other research applications. MPD’s primary source of funding is NIDA. For this reason, a majority of MPD data is neuro- and behavior-related.
Difficulty level: Beginner
Duration: 55:36
Speaker: : Elissa Chesler

This lecture provides an introductory overview of some of the most important concepts in software engineering.
Difficulty level: Beginner
Duration: 32:59
Speaker: : Jeff Muller

In this lesson, you will learn in more detail about neuromorphic computing, that is, non-standard computational architectures that mimic some aspect of the way the brain works.
Difficulty level: Intermediate
Duration: 10:08
Speaker: : Dan Goodman

This video provides a very quick introduction to some of the neuromorphic sensing devices, and how they offer unique, low-power applications.
Difficulty level: Intermediate
Duration: 2:37
Speaker: : Dan Goodman

Course:
Overview of the content for Day 1 of this course.
Difficulty level: Beginner
Duration: 00:01:59
Speaker: : Tristan Shuman

Course:
Overview of Day 2 of this course.
Difficulty level: Beginner
Duration: 00:03:28
Speaker: : Tristan Shuman

Course:
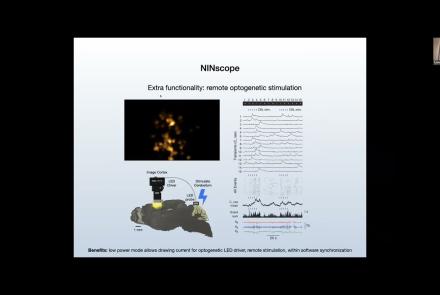
Best practices: the tips and tricks on how to get your Miniscope to work and how to get your experiments off the ground.
Difficulty level: Beginner
Duration: 00:53:34

Course:
This talk compares various sensors and resolutions for in vivo neural recordings.
Difficulty level: Beginner
Duration: 00:24:03
Speaker: : Susie Feng, Zach Pennington, Caleb Kemere
Course:
This talk delves into challenges and opportunities of Miniscope design, seeking the optimal balance between scale and function.
Difficulty level: Beginner
Duration: 00:21:51
Speaker: : Susie Feng, Zach Pennington, Tycho Hoogland

Course:
Attendees of this talk will learn aobut computational imaging systems and associated pipelines, as well as open-source software solutions supporting miniscope use.
Difficulty level: Beginner
Duration: 00:17:56
Speaker: : Susie Feng, Zach Pennington, Laura Waller

Course:
This lecture introduces neuroscience concepts and methods such as fMRI, visual respones in BOLD data, and the eccentricity of visual receptive fields.
Difficulty level: Intermediate
Duration: 7:15
Speaker: : Mike X. Cohen

Course:
This tutorial walks users through the creation and visualization of activation flat maps from fMRI datasets.
Difficulty level: Intermediate
Duration: 12:15
Speaker: : Mike X. Cohen

Course:
This talk covers the present state and future directions of calcium imaging data analysis, particularly in the context of one-photon vs two-photon approaches.
Difficulty level: Beginner
Duration: 00:21:06

Course:
This tutorial demonstrates to users the conventional preprocessing steps when working with BOLD signal datasets from fMRI.
Difficulty level: Intermediate
Duration: 12:05
Speaker: : Mike X. Cohen

Course:
In this tutorial, users will learn how to create a trial-averaged BOLD response and store it in a matrix in MATLAB.
Difficulty level: Intermediate
Duration: 20:12
Speaker: : Mike X. Cohen

Course:
This tutorial teaches users how to create animations of BOLD responses over time, to allow researchers and clinicians to visualize time-course activity patterns.
Difficulty level: Intermediate
Duration: 12:52
Speaker: : Mike X. Cohen