Lesson type
Difficulty level

Course:
The Mouse Phenome Database (MPD) provides access to primary experimental trait data, genotypic variation, protocols and analysis tools for mouse genetic studies. Data are contributed by investigators worldwide and represent a broad scope of phenotyping endpoints and disease-related traits in naïve mice and those exposed to drugs, environmental agents or other treatments. MPD ensures rigorous curation of phenotype data and supporting documentation using relevant ontologies and controlled vocabularies. As a repository of curated and integrated data, MPD provides a means to access/re-use baseline data, as well as allows users to identify sensitized backgrounds for making new mouse models with genome editing technologies, analyze trait co-inheritance, benchmark assays in their own laboratories, and many other research applications. MPD’s primary source of funding is NIDA. For this reason, a majority of MPD data is neuro- and behavior-related.
Difficulty level: Beginner
Duration: 55:36
Speaker: : Elissa Chesler

Course:
This lesson introduces the EEGLAB toolbox, as well as motivations for its use.
Difficulty level: Beginner
Duration: 15:32
Speaker: : Arnaud Delorme
Course:
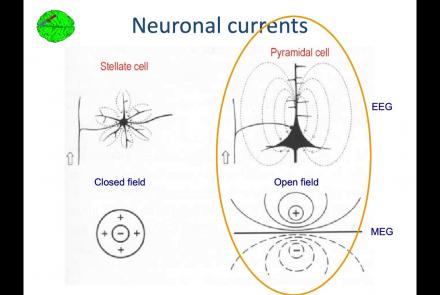
In this lesson, you will learn about the biological activity which generates and is measured by the EEG signal.
Difficulty level: Beginner
Duration: 6:53
Speaker: : Arnaud Delorme

Course:
This lesson goes over the characteristics of EEG signals when analyzed in source space (as opposed to sensor space).
Difficulty level: Beginner
Duration: 10:56
Speaker: : Arnaud Delorme

Course:
This lesson describes the development of EEGLAB as well as to what extent it is used by the research community.
Difficulty level: Beginner
Duration: 6:06
Speaker: : Arnaud Delorme

Course:
This lesson provides instruction as to how to build a processing pipeline in EEGLAB for a single participant.
Difficulty level: Beginner
Duration: 9:20
Speaker: :

Course:
Whereas the previous lesson of this course outlined how to build a processing pipeline for a single participant, this lesson discusses analysis pipelines for multiple participants simultaneously.
Difficulty level: Beginner
Duration: 10:55
Speaker: : Arnaud Delorme

Course:
In addition to outlining the motivations behind preprocessing EEG data in general, this lesson covers the first step in preprocessing data with EEGLAB, importing raw data.
Difficulty level: Beginner
Duration: 8:30
Speaker: : Arnaud Delorme

Course:
Continuing along the EEGLAB preprocessing pipeline, this tutorial walks users through how to import data events as well as EEG channel locations.
Difficulty level: Beginner
Duration: 11:53
Speaker: : Arnaud Delorme

Course:
This tutorial instructs users how to visually inspect partially pre-processed neuroimaging data in EEGLAB, specifically how to use the data browser to investigate specific channels, epochs, or events for removable artifacts, biological (e.g., eye blinks, muscle movements, heartbeat) or otherwise (e.g., corrupt channel, line noise).
Difficulty level: Beginner
Duration: 5:08
Speaker: : Arnaud Delorme

Course:
This tutorial provides instruction on how to use EEGLAB to further preprocess EEG datasets by identifying and discarding bad channels which, if left unaddressed, can corrupt and confound subsequent analysis steps.
Difficulty level: Beginner
Duration: 13:01
Speaker: : Arnaud Delorme

Course:
Users following this tutorial will learn how to identify and discard bad EEG data segments using the MATLAB toolbox EEGLAB.
Difficulty level: Beginner
Duration: 11:25
Speaker: : Arnaud Delorme

This lecture gives an overview of how to prepare and preprocess neuroimaging (EEG/MEG) data for use in TVB.
Difficulty level: Intermediate
Duration: 1:40:52
Speaker: : Paul Triebkorn

Course:
Longitudinal Online Research and Imaging System (LORIS) is a web-based data and project management software for neuroimaging research studies. It is an open source framework for storing and processing behavioural, clinical, neuroimaging and genetic data. LORIS also makes it easy to manage large datasets acquired over time in a longitudinal study, or at different locations in a large multi-site study.
Difficulty level: Beginner
Duration: 0:35
Speaker: : Samir Das

Course:
This lecture covers the rationale for developing the DAQCORD, a framework for the design, documentation, and reporting of data curation methods in order to advance the scientific rigour, reproducibility, and analysis of data.
Difficulty level: Intermediate
Duration: 17:08
Speaker: : Ari Ercole

The Medical Informatics Platform (MIP) is a platform providing federated analytics for diagnosis and research in clinical neuroscience research. The federated analytics is possible thanks to a distributed engine that executes computations and transfers information between the members of the federation (hospital nodes). In this talk the speaker will describe the process of designing and implementing new analytical tools, i.e. statistical and machine learning algorithms. Mr. Sakellariou will further describe the environment in which these federated algorithms run, the challenges and the available tools, the principles that guide its design and the followed general methodology for each new algorithm. One of the most important challenges which are faced is to design these tools in a way that does not compromise the privacy of the clinical data involved. The speaker will show how to address the main questions when designing such algorithms: how to decompose and distribute the computations and what kind of information to exchange between nodes, in order to comply with the privacy constraint mentioned above. Finally, also the subject of validating these federated algorithms will be briefly touched.
Difficulty level: Intermediate
Duration: 20:26
Speaker: : Jason Skellariou

This tutorial demonstrates how to perform cell-type deconvolution in order to estimate how proportions of cell-types in the brain change in response to various conditions. While these techniques may be useful in addressing a wide range of scientific questions, this tutorial will focus on the cellular changes associated with major depression (MDD).
Difficulty level: Intermediate
Duration: 1:15:14
Speaker: : Keon Arbabi

This is a hands-on tutorial on PLINK, the open source whole genome association analysis toolset. The aims of this tutorial are to teach users how to perform basic quality control on genetic datasets, as well as to identify and understand GWAS summary statistics.
Difficulty level: Intermediate
Duration: 1:27:18
Speaker: : Dan Felsky

This is a tutorial on using the open-source software PRSice to calculate a set of polygenic risk scores (PRS) for a study sample. Users will also learn how to read PRS into R, visualize distributions, and perform basic association analyses.
Difficulty level: Intermediate
Duration: 1:53:34
Speaker: : Dan Felsky
This lesson contains the slides (pptx) of a lecture discussing the necessary concepts and tools for taking into account population stratification and admixture in the context of genome-wide association studies (GWAS). The free-access software Tractor and its advantages in GWAS are also discussed.
Difficulty level: Intermediate
Duration:
Speaker: : Dan Felsky