Lesson type
Difficulty level

Explore how to setup an epileptic seizure simulation with the TVB graphical user interface. This lesson will show you how to program the epileptor model in the brain network to simulate a epileptic seizure originating in the hippocampus. It will also show how to upload and view mouse connectivity data, as well as give a short introduction to the python script interface of TVB.
Difficulty level: Intermediate
Duration: 58:06
Speaker: : Paul Triebkorn

Course:
In this lesson you will learn how to simulate seizure events and epilepsy in The Virtual Brain. We will look at the paper On the Nature of Seizure Dynamics, which describes a new local model called the Epileptor, and apply this same model in The Virtual Brain. This is part 1 of 2 in a series explaining how to use the Epileptor. In this part, we focus on setting up the parameters.
Difficulty level: Beginner
Duration: 4:44
Speaker: : Paul Triebkorn

This lecture describes how to build research workflows, including a demonstrate using DataJoint Elements to build data pipelines.
Difficulty level: Intermediate
Duration: 47:00
Speaker: : Dimitri Yatsenko

This talk covers the differences between applying HED annotation to fMRI datasets versus other neuroimaging practices, and also introduces an analysis pipeline using HED tags.
Difficulty level: Beginner
Duration: 22:52
Speaker: : Monique Denissen

Course:
Longitudinal Online Research and Imaging System (LORIS) is a web-based data and project management software for neuroimaging research studies. It is an open source framework for storing and processing behavioural, clinical, neuroimaging and genetic data. LORIS also makes it easy to manage large datasets acquired over time in a longitudinal study, or at different locations in a large multi-site study.
Difficulty level: Beginner
Duration: 0:35
Speaker: : Samir Das

Course:
This talk covers the Neuroimaging Informatics Tools and Resources Clearinghouse (NITRC), a free one-stop-shop collaboratory for science researchers that need resources such as neuroimaging analysis software, publicly available data sets, or computing power.
Difficulty level: Beginner
Duration: 1:00:10
Speaker: : David Kennedy

Course:
In this lesson, you will learn about the Python project Nipype, an open-source, community-developed initiative under the umbrella of NiPy. Nipype provides a uniform interface to existing neuroimaging software and facilitates interaction between these packages within a single workflow.
Difficulty level: Intermediate
Duration: 1:25:05
Speaker: : Satrajit Ghosh

Course:
This lecture introduces you to the basics of the Amazon Web Services public cloud. It covers the fundamentals of cloud computing and goes through both the motivations and processes involved in moving your research computing to the cloud.
Difficulty level: Intermediate
Duration: 3:09:12
Speaker: : Amanda Tan & Ariel Rokem

This lecture gives an overview of how to prepare and preprocess neuroimaging (EEG/MEG) data for use in TVB.
Difficulty level: Intermediate
Duration: 1:40:52
Speaker: : Paul Triebkorn

Course:
BioImage Suite is an integrated image analysis software suite developed at Yale University. BioImage Suite has been extensively used at different labs at Yale since about 2001.
Difficulty level: Beginner
Duration: 01:47
Speaker: : BioImage Suite

Course:
Fibr is an app for quality control of diffusion MRI images from the Healthy Brain Network, a landmark mental health study that is collecting MRI images and other assessment data from 10,000 New York City area children. The purpose of the app is to train a computer algorithm to analyze the Healthy Brain Network dataset. By playing fibr, you are helping to teach the computer which images have sufficiently good quality and which images do not.
Difficulty level: Beginner
Duration: 02:26
Speaker: : Ariel Rokem

Course:
This lesson provides an overview of the Miniscope project, explaining the motivation behind the how and why of Miniscope development, why Miniscopes may be useful for researchers, and the differences between previous and current versions.
Difficulty level: Beginner
Duration: 42:16
Speaker: : Daniel Aharoni
Course:
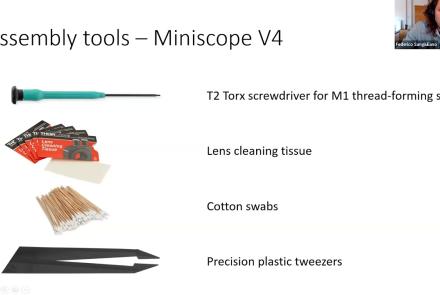
This lesson provides instruction on how to build a Miniscope and stream data, including an overview of the software involved.
Difficulty level: Beginner
Duration: 1:04:28
Speaker: : Daniel Aharoni and Federico Sangiuliano

Course:
JupyterHub is a simple, highly extensible, multi-user system for managing per-user Jupyter Notebook servers, designed for research groups or classes. This lecture covers deploying JupyterHub on a single server, as well as deploying with Docker using GitHub for authentication.
Difficulty level: Beginner
Duration: 1:36:27
Speaker: : Thomas Kluyver

Course:
This demonstration walks through how to import your data into MATLAB.
Difficulty level: Beginner
Duration: 6:10
Speaker: : MATLAB®

Course:
This lesson provides instruction regarding the various factors one must consider when preprocessing data, preparing it for statistical exploration and analyses.
Difficulty level: Beginner
Duration: 15:10
Speaker: : MATLAB®

Course:
This tutorial outlines, step by step, how to perform analysis by group and how to do change-point detection.
Difficulty level: Beginner
Duration: 2:49
Speaker: : MATLAB®

Course:
This tutorial walks through several common methods for visualizing your data in different ways depending on your data type.
Difficulty level: Beginner
Duration: 6:10
Speaker: : MATLAB®

Course:
This tutorial illustrates several ways to approach predictive modeling and machine learning with MATLAB.
Difficulty level: Beginner
Duration: 6:27
Speaker: : MATLAB®

Course:
This brief tutorial goes over how you can easily work with big data as you would with any size of data.
Difficulty level: Beginner
Duration: 3:55
Speaker: : MATLAB®