Lesson type
Difficulty level

Course:
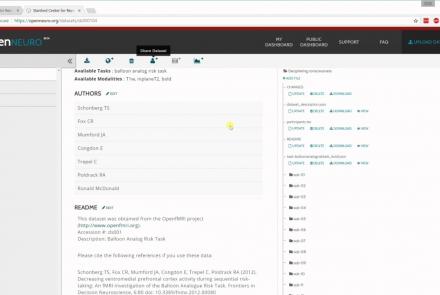
In this tutorial, you will learn the basic features of uploading and versioning your data within OpenNeuro.org.
Difficulty level: Beginner
Duration: 5:36
Speaker: : OpenNeuro
Course:
This tutorial shows how to share your data in OpenNeuro.org.
Difficulty level: Beginner
Duration: 1:22
Speaker: : OpenNeuro

Course:
Following the previous two tutorials on uploading and sharing data with OpenNeuro.org, this tutorial briefly covers how to run various analyses on your datasets.
Difficulty level: Beginner
Duration: 2:26
Speaker: : OpenNeuro

Explore how to setup an epileptic seizure simulation with the TVB graphical user interface. This lesson will show you how to program the epileptor model in the brain network to simulate a epileptic seizure originating in the hippocampus. It will also show how to upload and view mouse connectivity data, as well as give a short introduction to the python script interface of TVB.
Difficulty level: Intermediate
Duration: 58:06
Speaker: : Paul Triebkorn

Course:
In this lesson you will learn how to simulate seizure events and epilepsy in The Virtual Brain. We will look at the paper On the Nature of Seizure Dynamics, which describes a new local model called the Epileptor, and apply this same model in The Virtual Brain. This is part 1 of 2 in a series explaining how to use the Epileptor. In this part, we focus on setting up the parameters.
Difficulty level: Beginner
Duration: 4:44
Speaker: : Paul Triebkorn

Course:
This lesson provides an overview of GeneWeaver, a web application for the integrated cross-species analysis of functional genomics data to find convergent evidence from heterogeneous sources.
Difficulty level: Beginner
Duration: 1:03:26
Speaker: : Erich J. Baker

Course:
This lesson provides a demonstration of GeneWeaver, a system for the integration and analysis of heterogeneous functional genomics data.
Difficulty level: Beginner
Duration: 25:53
Speaker: :

Course:
Longitudinal Online Research and Imaging System (LORIS) is a web-based data and project management software for neuroimaging research studies. It is an open source framework for storing and processing behavioural, clinical, neuroimaging and genetic data. LORIS also makes it easy to manage large datasets acquired over time in a longitudinal study, or at different locations in a large multi-site study.
Difficulty level: Beginner
Duration: 0:35
Speaker: : Samir Das

This talk highlights a set of platform technologies, software, and data collections that close and shorten the feedback cycle in research.
Difficulty level: Beginner
Duration: 57:52
Speaker: : Satrajit Ghosh

This lesson describes how DataLad allows you to track and mange both your data and analysis code, thereby facilitating reliable, reproducible, and shareable research.
Difficulty level: Intermediate
Duration: 59:34
Speaker: : Yaroslav O. Halchenko

Course:
This lecture outlines GeneNetwork.org, a group of linked data sets and tools used to study complex networks of genes, molecules, and higher order gene function and phenotypes.
Difficulty level: Beginner
Duration: 1:00:43
Speaker: : Robert Williams

Course:
This lesson describes the Neuroscience Gateway , which facilitates access and use of National Science Foundation High Performance Computing resources by neuroscientists.
Difficulty level: Beginner
Duration: 39:27
Speaker: : Subha Sivagnanam

Course:
This tutorial shows how to use the UCSC genome browser to find a list of genes in a given genomic region.
Difficulty level: Beginner
Duration: 4:32
Speaker: : UCSC Genome Browser

Course:
This tutorial shows how to find all the single nucleotide polymorphisms (SNPs) upstream from genes using the UCSC Genome Browser.
Difficulty level: Beginner
Duration: 8:13
Speaker: : UCSC Genome Browser

Course:
This tutorial demonstrates how to find all the single nucleotide polymorphisms (SNPs) in a gene using the UCSC Genome Browser.
Difficulty level: Beginner
Duration: 6:12
Speaker: : UCSC Genome Browser

Course:
The Saved Sessions feature of the Browser has been around for quite some time, but many of our users have not made full use of it. This feature offers a great way to keep track of your thinking on a particular topic.
Difficulty level: Beginner
Duration: 7:16
Speaker: : UCSC Genome Browser

Course:
The Track Collection Builder is a new tool in the UCSC Genome Browser that provides a way to create grouped collections of sub-tracks with native tracks, custom tracks, or hub tracks of continuous value graphing data types.
Difficulty level: Beginner
Duration: 2:18
Speaker: : UCSC Genome Browser

Course:
This tutorial demonstrates the visibility controls on the Genome Browser, showing the effect on BED tracks, wiggle tracks, and Conservation tracks. It also discusses supertracks and composite tracks.
Difficulty level: Beginner
Duration: 14:30
Speaker: : UCSC Genome Browser

Course:
This tutorial describes the isPCR tool and demonstrates how to use it for predicting the size and location of PCR products and visualizing the genomic location on the genome. The tool operates on DNA templates for all organisms, and on human and mouse DNA/RNA. It also demonstrates how to use the Browser to obtain DNA sequences from the genome.
Difficulty level: Beginner
Duration: 8:01
Speaker: : UCSC Genome Browser

Course:
This tutorial describes the dbSNP resources in the UCSC Genome Browser, including display conventions and the subdivision of the data into several useful subset tracks, especially the Common SNPs. There is also a discussion about changes to the genome assemblies from one version to another, and of two ways to navigate between different assemblies of the human genome in the Browser.
Difficulty level: Beginner
Duration: 17:41
Speaker: : UCSC Genome Browser