Lesson type
Difficulty level

This is a hands-on tutorial on PLINK, the open source whole genome association analysis toolset. The aims of this tutorial are to teach users how to perform basic quality control on genetic datasets, as well as to identify and understand GWAS summary statistics.
Difficulty level: Intermediate
Duration: 1:27:18
Speaker: : Dan Felsky

This is a tutorial on using the open-source software PRSice to calculate a set of polygenic risk scores (PRS) for a study sample. Users will also learn how to read PRS into R, visualize distributions, and perform basic association analyses.
Difficulty level: Intermediate
Duration: 1:53:34
Speaker: : Dan Felsky
This lesson contains the slides (pptx) of a lecture discussing the necessary concepts and tools for taking into account population stratification and admixture in the context of genome-wide association studies (GWAS). The free-access software Tractor and its advantages in GWAS are also discussed.
Difficulty level: Intermediate
Duration:
Speaker: : Dan Felsky

This is a tutorial introducing participants to the basics of RNA-sequencing data and how to analyze its features using Seurat.
Difficulty level: Intermediate
Duration: 1:19:17
Speaker: : Sonny Chen

This tutorial demonstrates how to perform cell-type deconvolution in order to estimate how proportions of cell-types in the brain change in response to various conditions. While these techniques may be useful in addressing a wide range of scientific questions, this tutorial will focus on the cellular changes associated with major depression (MDD).
Difficulty level: Intermediate
Duration: 1:15:14
Speaker: : Keon Arbabi

This talk covers the differences between applying HED annotation to fMRI datasets versus other neuroimaging practices, and also introduces an analysis pipeline using HED tags.
Difficulty level: Beginner
Duration: 22:52
Speaker: : Monique Denissen

Explore how to setup an epileptic seizure simulation with the TVB graphical user interface. This lesson will show you how to program the epileptor model in the brain network to simulate a epileptic seizure originating in the hippocampus. It will also show how to upload and view mouse connectivity data, as well as give a short introduction to the python script interface of TVB.
Difficulty level: Intermediate
Duration: 58:06
Speaker: : Paul Triebkorn

Course:
In this lesson you will learn how to simulate seizure events and epilepsy in The Virtual Brain. We will look at the paper On the Nature of Seizure Dynamics, which describes a new local model called the Epileptor, and apply this same model in The Virtual Brain. This is part 1 of 2 in a series explaining how to use the Epileptor. In this part, we focus on setting up the parameters.
Difficulty level: Beginner
Duration: 4:44
Speaker: : Paul Triebkorn

Course:
This lesson provides an overview of GeneWeaver, a web application for the integrated cross-species analysis of functional genomics data to find convergent evidence from heterogeneous sources.
Difficulty level: Beginner
Duration: 1:03:26
Speaker: : Erich J. Baker

Course:
This lesson provides a demonstration of GeneWeaver, a system for the integration and analysis of heterogeneous functional genomics data.
Difficulty level: Beginner
Duration: 25:53
Speaker: :

Course:
Longitudinal Online Research and Imaging System (LORIS) is a web-based data and project management software for neuroimaging research studies. It is an open source framework for storing and processing behavioural, clinical, neuroimaging and genetic data. LORIS also makes it easy to manage large datasets acquired over time in a longitudinal study, or at different locations in a large multi-site study.
Difficulty level: Beginner
Duration: 0:35
Speaker: : Samir Das

Course:
This lecture outlines GeneNetwork.org, a group of linked data sets and tools used to study complex networks of genes, molecules, and higher order gene function and phenotypes.
Difficulty level: Beginner
Duration: 1:00:43
Speaker: : Robert Williams

Course:
This talk covers the Neuroimaging Informatics Tools and Resources Clearinghouse (NITRC), a free one-stop-shop collaboratory for science researchers that need resources such as neuroimaging analysis software, publicly available data sets, or computing power.
Difficulty level: Beginner
Duration: 1:00:10
Speaker: : David Kennedy

Course:
This lesson describes the Neuroscience Gateway , which facilitates access and use of National Science Foundation High Performance Computing resources by neuroscientists.
Difficulty level: Beginner
Duration: 39:27
Speaker: : Subha Sivagnanam

Course:
This lesson provides an overview of the database of Genotypes and Phenotypes (dbGaP), which was developed to archive and distribute the data and results from studies that have investigated the interaction of genotype and phenotype in humans.
Difficulty level: Beginner
Duration: 48:22
Speaker: : Michael Feolo

Course:
This lesson introduces the EEGLAB toolbox, as well as motivations for its use.
Difficulty level: Beginner
Duration: 15:32
Speaker: : Arnaud Delorme
Course:
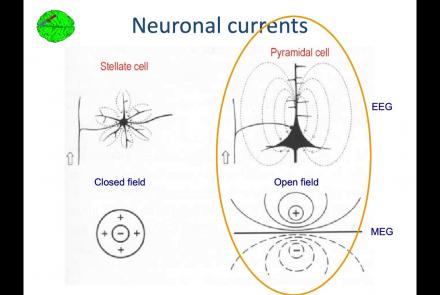
In this lesson, you will learn about the biological activity which generates and is measured by the EEG signal.
Difficulty level: Beginner
Duration: 6:53
Speaker: : Arnaud Delorme

Course:
This lesson goes over the characteristics of EEG signals when analyzed in source space (as opposed to sensor space).
Difficulty level: Beginner
Duration: 10:56
Speaker: : Arnaud Delorme

Course:
This lesson describes the development of EEGLAB as well as to what extent it is used by the research community.
Difficulty level: Beginner
Duration: 6:06
Speaker: : Arnaud Delorme

Course:
This lesson provides instruction as to how to build a processing pipeline in EEGLAB for a single participant.
Difficulty level: Beginner
Duration: 9:20
Speaker: :