Lesson type
Difficulty level

Course:
This lesson introduces the EEGLAB toolbox, as well as motivations for its use.
Difficulty level: Beginner
Duration: 15:32
Speaker: : Arnaud Delorme
Course:
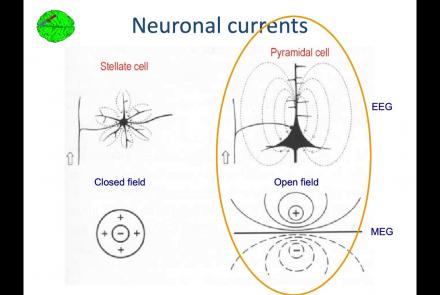
In this lesson, you will learn about the biological activity which generates and is measured by the EEG signal.
Difficulty level: Beginner
Duration: 6:53
Speaker: : Arnaud Delorme

Course:
This lesson goes over the characteristics of EEG signals when analyzed in source space (as opposed to sensor space).
Difficulty level: Beginner
Duration: 10:56
Speaker: : Arnaud Delorme

Course:
This lesson describes the development of EEGLAB as well as to what extent it is used by the research community.
Difficulty level: Beginner
Duration: 6:06
Speaker: : Arnaud Delorme

Course:
This lesson provides instruction as to how to build a processing pipeline in EEGLAB for a single participant.
Difficulty level: Beginner
Duration: 9:20
Speaker: :

Course:
Whereas the previous lesson of this course outlined how to build a processing pipeline for a single participant, this lesson discusses analysis pipelines for multiple participants simultaneously.
Difficulty level: Beginner
Duration: 10:55
Speaker: : Arnaud Delorme

Course:
In addition to outlining the motivations behind preprocessing EEG data in general, this lesson covers the first step in preprocessing data with EEGLAB, importing raw data.
Difficulty level: Beginner
Duration: 8:30
Speaker: : Arnaud Delorme

Course:
Continuing along the EEGLAB preprocessing pipeline, this tutorial walks users through how to import data events as well as EEG channel locations.
Difficulty level: Beginner
Duration: 11:53
Speaker: : Arnaud Delorme

Course:
This tutorial instructs users how to visually inspect partially pre-processed neuroimaging data in EEGLAB, specifically how to use the data browser to investigate specific channels, epochs, or events for removable artifacts, biological (e.g., eye blinks, muscle movements, heartbeat) or otherwise (e.g., corrupt channel, line noise).
Difficulty level: Beginner
Duration: 5:08
Speaker: : Arnaud Delorme

Course:
This tutorial provides instruction on how to use EEGLAB to further preprocess EEG datasets by identifying and discarding bad channels which, if left unaddressed, can corrupt and confound subsequent analysis steps.
Difficulty level: Beginner
Duration: 13:01
Speaker: : Arnaud Delorme

Course:
Users following this tutorial will learn how to identify and discard bad EEG data segments using the MATLAB toolbox EEGLAB.
Difficulty level: Beginner
Duration: 11:25
Speaker: : Arnaud Delorme

Course:
An introduction to data management, manipulation, visualization, and analysis for neuroscience. Students will learn scientific programming in Python, and use this to work with example data from areas such as cognitive-behavioral research, single-cell recording, EEG, and structural and functional MRI. Basic signal processing techniques including filtering are covered. The course includes a Jupyter Notebook and video tutorials.
Difficulty level: Beginner
Duration: 1:09:16
Speaker: : Aaron J. Newman

This lecture goes into detailed description of how to process workflows in the virtual research environment (VRE), including approaches for standardization, metadata, containerization, and constructing and maintaining scientific pipelines.
Difficulty level: Intermediate
Duration: 1:03:55
Speaker: : Patrik Bey

This lesson provides an overview of how to conceptualize, design, implement, and maintain neuroscientific pipelines in via the cloud-based computational reproducibility platform Code Ocean.
Difficulty level: Beginner
Duration: 17:01
Speaker: : David Feng

This lesson provides an overview of how to construct computational pipelines for neurophysiological data using DataJoint.
Difficulty level: Beginner
Duration: 17:37
Speaker: : Dimitri Yatsenko

This talk describes approaches to maintaining integrated workflows and data management schema, taking advantage of the many open source, collaborative platforms already existing.
Difficulty level: Beginner
Duration: 15:15
Speaker: : Erik C. Johnson

This lesson is the first of three hands-on tutorials as part of the workshop Research Workflows for Collaborative Neuroscience. This tutorial goes over how to visualize data with Scanpy, a scalable toolkit for analyzing single-cell gene expression.
Difficulty level: Intermediate
Duration: 25:26
Speaker: : David Feng & Frank Zappulla

This hands-on tutorial walks you through DataJoint platform, highlighting features and schema which can be used to build robost neuroscientific pipelines.
Difficulty level: Beginner
Duration: 26:06
Speaker: : Milagros Marin

In this third and final hands-on tutorial from the Research Workflows for Collaborative Neuroscience workshop, you will learn about workflow orchestration using open source tools like DataJoint and Flyte.
Difficulty level: Intermediate
Duration: 22:36
Speaker: : Daniel Xenes

This lecture provides a detailed description of how to incorporate HED annotation into your neuroimaging data pipeline.
Difficulty level: Beginner
Duration: 33:36
Speaker: : Dung Truong