Lesson type
Difficulty level

Course:
This hands-on tutorial explains how to run your own Minion session in the MetaCell cloud using jupityr notebooks.
Difficulty level: Beginner
Duration: 01:28:03
Speaker: : Daniel Aharoni, Phil Dong

This is an in-depth guide on EEG signals and their interaction within brain microcircuits. Participants are also shown techniques and software for simulating, analyzing, and visualizing these signals.
Difficulty level: Intermediate
Duration: 1:30:41
Speaker: : Frank Mazza

Course:
In this tutorial on simulating whole-brain activity using Python, participants can follow along using corresponding code and repositories, learning the basics of neural oscillatory dynamics, evoked responses and EEG signals, ultimately leading to the design of a network model of whole-brain anatomical connectivity.
Difficulty level: Intermediate
Duration: 1:16:10
Speaker: : John Griffiths

In this hands-on session, you will learn how to explore and work with DataLad datasets, containers, and structures using Jupyter notebooks.
Difficulty level: Beginner
Duration: 58:05
Speaker: : Michał Szczepanik

Course:
This lesson provides a brief overview of the Python programming language, with an emphasis on tools relevant to data scientists.
Difficulty level: Beginner
Duration: 1:16:36
Speaker: : Tal Yarkoni

Course:
An introduction to data management, manipulation, visualization, and analysis for neuroscience. Students will learn scientific programming in Python, and use this to work with example data from areas such as cognitive-behavioral research, single-cell recording, EEG, and structural and functional MRI. Basic signal processing techniques including filtering are covered. The course includes a Jupyter Notebook and video tutorials.
Difficulty level: Beginner
Duration: 1:09:16
Speaker: : Aaron J. Newman
Course:
This book was written with the goal of introducing researchers and students in a variety of research fields to the intersection of data science and neuroimaging. This book reflects our own experience of doing research at the intersection of data science and neuroimaging and it is based on our experience working with students and collaborators who come from a variety of backgrounds and have a variety of reasons for wanting to use data science approaches in their work. The tools and ideas that we chose to write about are all tools and ideas that we have used in some way in our own research. Many of them are tools that we use on a daily basis in our work. This was important to us for a few reasons: the first is that we want to teach people things that we ourselves find useful. Second, it allowed us to write the book with a focus on solving specific analysis tasks. For example, in many of the chapters you will see that we walk you through ideas while implementing them in code, and with data. We believe that this is a good way to learn about data analysis, because it provides a connecting thread from scientific questions through the data and its representation to implementing specific answers to these questions. Finally, we find these ideas compelling and fruitful. That’s why we were drawn to them in the first place. We hope that our enthusiasm about the ideas and tools described in this book will be infectious enough to convince the readers of their value.
Difficulty level: Intermediate
Duration:
Speaker: :
Course:
This Jupyter Book is a series of interactive tutorials about quantitative T1 mapping, powered by qMRLab. Most figures are generated with Plot.ly – you can play with them by hovering your mouse over the data, zooming in (click and drag) and out (double click), moving the sliders, and changing the drop-down options. To view the code that was used to generate the figures in this blog post, hover your cursor in the top left corner of the frame that contains the tutorial and click the checkbox “All cells” in the popup that appears.
Jupyter Lab notebooks of these tutorials are also available through MyBinder, and inline code modification inside the Jupyter Book is provided by Thebelab. For both options, you can modify the code, change the figures, and regenerate the html that was used to create the tutorial below. This Jupyter Book also uses a Script of Scripts (SoS) kernel, allowing us to process the data using qMRLab in MATLAB/Octave and plot the figures with Plot.ly using Python, all within the same Jupyter Notebook.
Difficulty level: Intermediate
Duration:
Speaker: :

This talk covers the differences between applying HED annotation to fMRI datasets versus other neuroimaging practices, and also introduces an analysis pipeline using HED tags.
Difficulty level: Beginner
Duration: 22:52
Speaker: : Monique Denissen

Course:
This lecture focuses on where and how Jupyter notebooks can be used most effectively for education.
Difficulty level: Beginner
Duration: 34:53
Speaker: : Thomas Kluyver

Course:
JupyterHub is a simple, highly extensible, multi-user system for managing per-user Jupyter Notebook servers, designed for research groups or classes. This lecture covers deploying JupyterHub on a single server, as well as deploying with Docker using GitHub for authentication.
Difficulty level: Beginner
Duration: 1:36:27
Speaker: : Thomas Kluyver

This lesson introduces the practical usage of The Virtual Brain (TVB) in its graphical user interface and via python scripts. In the graphical user interface, you are guided through its data repository, simulator, phase plane exploration tool, connectivity editor, stimulus generator, and the provided analyses. The implemented iPython notebooks of TVB are presented, and since they are public, can be used for further exploration of TVB.
Difficulty level: Beginner
Duration: 1:12:24
Speaker: : Paul Triebkorn

Explore how to setup an epileptic seizure simulation with the TVB graphical user interface. This lesson will show you how to program the epileptor model in the brain network to simulate a epileptic seizure originating in the hippocampus. It will also show how to upload and view mouse connectivity data, as well as give a short introduction to the python script interface of TVB.
Difficulty level: Intermediate
Duration: 58:06
Speaker: : Paul Triebkorn

Course:
In this lesson you will learn how to simulate seizure events and epilepsy in The Virtual Brain. We will look at the paper On the Nature of Seizure Dynamics, which describes a new local model called the Epileptor, and apply this same model in The Virtual Brain. This is part 1 of 2 in a series explaining how to use the Epileptor. In this part, we focus on setting up the parameters.
Difficulty level: Beginner
Duration: 4:44
Speaker: : Paul Triebkorn

Course:
Longitudinal Online Research and Imaging System (LORIS) is a web-based data and project management software for neuroimaging research studies. It is an open source framework for storing and processing behavioural, clinical, neuroimaging and genetic data. LORIS also makes it easy to manage large datasets acquired over time in a longitudinal study, or at different locations in a large multi-site study.
Difficulty level: Beginner
Duration: 0:35
Speaker: : Samir Das

Course:
This talk covers the Neuroimaging Informatics Tools and Resources Clearinghouse (NITRC), a free one-stop-shop collaboratory for science researchers that need resources such as neuroimaging analysis software, publicly available data sets, or computing power.
Difficulty level: Beginner
Duration: 1:00:10
Speaker: : David Kennedy

Course:
This lesson provides an overview of the database of Genotypes and Phenotypes (dbGaP), which was developed to archive and distribute the data and results from studies that have investigated the interaction of genotype and phenotype in humans.
Difficulty level: Beginner
Duration: 48:22
Speaker: : Michael Feolo

Course:
This lesson introduces the EEGLAB toolbox, as well as motivations for its use.
Difficulty level: Beginner
Duration: 15:32
Speaker: : Arnaud Delorme
Course:
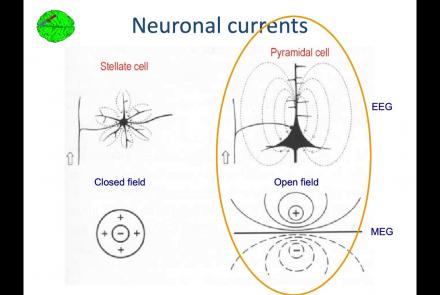
In this lesson, you will learn about the biological activity which generates and is measured by the EEG signal.
Difficulty level: Beginner
Duration: 6:53
Speaker: : Arnaud Delorme

Course:
This lesson goes over the characteristics of EEG signals when analyzed in source space (as opposed to sensor space).
Difficulty level: Beginner
Duration: 10:56
Speaker: : Arnaud Delorme