Lesson type
Difficulty level

This is the first of two workshops on reproducibility in science, during which participants are introduced to concepts of FAIR and open science. After discussing the definition of and need for FAIR science, participants are walked through tutorials on installing and using Github and Docker, the powerful, open-source tools for versioning and publishing code and software, respectively.
Difficulty level: Intermediate
Duration: 1:20:58
Speaker: : Erin Dickie and Sejal Patel

Course:
In this lesson, while learning about the need for increased large-scale collaborative science that is transparent in nature, users also are given a tutorial on using Synapse for facilitating reusable and reproducible research.
Difficulty level: Beginner
Duration: 1:15:12
Speaker: : Abhi Pratap

Learn how to create a standard extracellular electrophysiology dataset in NWB using Python.
Difficulty level: Intermediate
Duration: 23:10
Speaker: : Ryan Ly

Learn how to create a standard calcium imaging dataset in NWB using Python.
Difficulty level: Intermediate
Duration: 31:04
Speaker: : Ryan Ly

In this tutorial, you will learn how to create a standard intracellular electrophysiology dataset in NWB using Python.
Difficulty level: Intermediate
Duration: 20:23
Speaker: : Pamela Baker
Learn how to create a standard intracellular electrophysiology dataset in NWB.
Difficulty level: Intermediate
Duration: 20:22
Speaker: : Pamela Baker
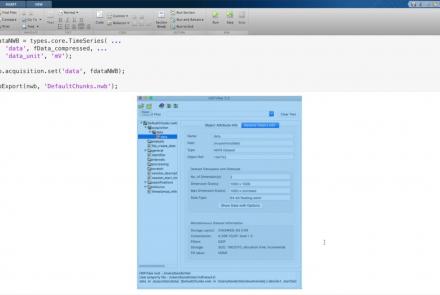
This lesson provides a tutorial on how to handle writing very large data in MatNWB.
Difficulty level: Advanced
Duration: 16:18
Speaker: : Ben Dichter

This lesson provides an overview of the CaImAn package, as well as a demonstration of usage with NWB.
Difficulty level: Intermediate
Duration: 44:37
Speaker: : Andrea Giovannucci

This lesson gives an overview of the SpikeInterface package, including demonstration of data loading, preprocessing, spike sorting, and comparison of spike sorters.
Difficulty level: Intermediate
Duration: 1:10:28
Speaker: : Alessio Buccino

In this lesson, users will learn about the NWBWidgets package, including coverage of different data types, and information for building custom widgets within this framework.
Difficulty level: Intermediate
Duration: 47:15
Speaker: : Ben Dichter

This hands-on tutorial walks you through DataJoint platform, highlighting features and schema which can be used to build robost neuroscientific pipelines.
Difficulty level: Beginner
Duration: 26:06
Speaker: : Milagros Marin

This tutorial provides instruction on how to simulate brain tumors with TVB (reproducing publication: Marinazzo et al. 2020 Neuroimage). This tutorial comprises a didactic video, jupyter notebooks, and full data set for the construction of virtual brains from patients and health controls.
Difficulty level: Intermediate
Duration: 10:01

The tutorial on modelling strokes in TVB includes a didactic video and jupyter notebooks (reproducing publication: Falcon et al. 2016 eNeuro).
Difficulty level: Intermediate
Duration: 7:43

This is a tutorial on designing a Bayesian inference model to map belief trajectories, with emphasis on gaining familiarity with Hierarchical Gaussian Filters (HGFs).
This lesson corresponds to slides 65-90 of the PDF below.
Difficulty level: Intermediate
Duration: 1:15:04
Speaker: : Daniel Hauke

Course:
This tutorial introduces pipelines and methods to compute brain connectomes from fMRI data. With corresponding code and repositories, participants can follow along and learn how to programmatically preprocess, curate, and analyze functional and structural brain data to produce connectivity matrices.
Difficulty level: Intermediate
Duration: 1:39:04
Speaker: : Erin Dickie and John Griffiths

This lesson introduces the practical exercises which accompany the previous lessons on animal and human connectomes in the brain and nervous system.
Difficulty level: Intermediate
Duration: 4:10
Speaker: : Dan Goodman

Course:
This demonstration walks through how to import your data into MATLAB.
Difficulty level: Beginner
Duration: 6:10
Speaker: : MATLAB®

Course:
This lesson provides instruction regarding the various factors one must consider when preprocessing data, preparing it for statistical exploration and analyses.
Difficulty level: Beginner
Duration: 15:10
Speaker: : MATLAB®

Course:
This tutorial outlines, step by step, how to perform analysis by group and how to do change-point detection.
Difficulty level: Beginner
Duration: 2:49
Speaker: : MATLAB®

Course:
This tutorial walks through several common methods for visualizing your data in different ways depending on your data type.
Difficulty level: Beginner
Duration: 6:10
Speaker: : MATLAB®