Lesson type
Difficulty level

Explore how to setup an epileptic seizure simulation with the TVB graphical user interface. This lesson will show you how to program the epileptor model in the brain network to simulate a epileptic seizure originating in the hippocampus. It will also show how to upload and view mouse connectivity data, as well as give a short introduction to the python script interface of TVB.
Difficulty level: Intermediate
Duration: 58:06
Speaker: : Paul Triebkorn

Course:
In this lesson you will learn how to simulate seizure events and epilepsy in The Virtual Brain. We will look at the paper On the Nature of Seizure Dynamics, which describes a new local model called the Epileptor, and apply this same model in The Virtual Brain. This is part 1 of 2 in a series explaining how to use the Epileptor. In this part, we focus on setting up the parameters.
Difficulty level: Beginner
Duration: 4:44
Speaker: : Paul Triebkorn

The epilepsy SP actively promotes and supports epilepsy-related issues as well as educational and scientific activities within the framework of EAN. Our partners ILAE/ILAE Europe, EpiCare, EPNS and AOAN are actively involved. One of the major tasks is promoting submissions of session proposals for EAN congress balancing new scientific approaches and educational need for teaching courses. Outside of congress activities, contributions to e-learning facilities on the EAN website such as registrars reading list, scales and scores and breaking news are regularly presented or updated. Particular since the COVID pandemic, publications on COVID and any issues of epilepsy or seizures are regularly screened and summarized in neurology updates. In partnership with the ILAE/ILAE Europe, several guidelines are under preparation.
Difficulty level: Intermediate
Duration: 14:56
Speaker: : Tim J. von Oertzen

Course:
This tutorial is part 1 of 2. It aims to provide viewers with an understanding of the fundamentals of R tool. Note: parts 1 and 2 of this tutorial are part of the same YouTube video; part 1 ends at 17:42.
Difficulty level: Beginner
Duration: 17:42
Speaker: : Edureka

This lesson introduces the practical usage of The Virtual Brain (TVB) in its graphical user interface and via python scripts. In the graphical user interface, you are guided through its data repository, simulator, phase plane exploration tool, connectivity editor, stimulus generator, and the provided analyses. The implemented iPython notebooks of TVB are presented, and since they are public, can be used for further exploration of TVB.
Difficulty level: Beginner
Duration: 1:12:24
Speaker: : Paul Triebkorn

This tutorial covers the fundamentals of collaborating with Git and GitHub.
Difficulty level: Intermediate
Duration: 2:15:50
Speaker: : Elizabeth DuPre

Course:
This lesson provides a comprehensive introduction to the command line and 50 popular Linux commands. This is a long introduction (nearly 5 hours), but well worth it if you are going to spend a good part of your career working from a terminal, which is likely if you are interested in flexibility, power, and reproducibility in neuroscience research. This lesson is courtesy of freeCodeCamp.
Difficulty level: Beginner
Duration: 5:00:16
Speaker: : Colt Steele

Research Resource Identifiers (RRIDs) are ID numbers assigned to help researchers cite key resources (e.g., antibodies, model organisms, and software projects) in biomedical literature to improve the transparency of research methods.
Difficulty level: Beginner
Duration: 1:01:36
Speaker: : Maryann Martone

Course:
This lecture covers the rationale for developing the DAQCORD, a framework for the design, documentation, and reporting of data curation methods in order to advance the scientific rigour, reproducibility, and analysis of data.
Difficulty level: Intermediate
Duration: 17:08
Speaker: : Ari Ercole

Course:
This lecture describes the principles of EEG electrode placement in both 2- and 3-dimensional formats.
Difficulty level: Intermediate
Duration: 12:16
Speaker: : Mike X. Cohen

Course:
This tutorial walks users through performing Fourier Transform (FFT) spectral analysis of a single EEG channel using MATLAB.
Difficulty level: Intermediate
Duration: 13:39
Speaker: : Mike X. Cohen

Course:
This tutorial builds on the previous lesson's demonstration of spectral analysis of one EEG channel. Here, users will learn how to compute and visualize spectral power from all EEG channels using MATLAB.
Difficulty level: Intermediate
Duration: 12:34
Speaker: : Mike X. Cohen

Course:
In this lesson, users will learn more about the steady-state visually evoked potential (SSEVP), as well as how to create and interpret topographical maps derived from such studies.
Difficulty level: Intermediate
Duration: 9:10
Speaker: : Mike X. Cohen

Course:
This lesson teaches users how to extract edogenous brain waves from EEG data, specifically oscillations constrained to the 8-12 Hz frequency band, conventionally named alpha.
Difficulty level: Intermediate
Duration: 13:23
Speaker: : Mike X. Cohen

Course:
In the final lesson of this module, users will learn how to correlate endogenous alpha power with SSVEP amplitude from EEG data using MATLAB.
Difficulty level: Intermediate
Duration: 12:36
Speaker: : Mike X. Cohen

This is an in-depth guide on EEG signals and their interaction within brain microcircuits. Participants are also shown techniques and software for simulating, analyzing, and visualizing these signals.
Difficulty level: Intermediate
Duration: 1:30:41
Speaker: : Frank Mazza

Course:
In this tutorial on simulating whole-brain activity using Python, participants can follow along using corresponding code and repositories, learning the basics of neural oscillatory dynamics, evoked responses and EEG signals, ultimately leading to the design of a network model of whole-brain anatomical connectivity.
Difficulty level: Intermediate
Duration: 1:16:10
Speaker: : John Griffiths

Course:
This lesson introduces the EEGLAB toolbox, as well as motivations for its use.
Difficulty level: Beginner
Duration: 15:32
Speaker: : Arnaud Delorme
Course:
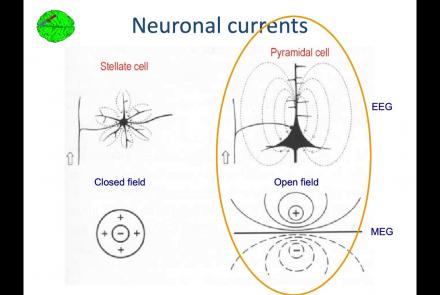
In this lesson, you will learn about the biological activity which generates and is measured by the EEG signal.
Difficulty level: Beginner
Duration: 6:53
Speaker: : Arnaud Delorme

Course:
This lesson goes over the characteristics of EEG signals when analyzed in source space (as opposed to sensor space).
Difficulty level: Beginner
Duration: 10:56
Speaker: : Arnaud Delorme