Lesson type
Difficulty level

This lesson gives a primer to project management in a scientific context, with a particular neuroinformatic case study.
Difficulty level: Beginner
Duration: 19:06
Speaker: : Kelly Shen

In this lesson, you will hear about the current challenges regarding data management, as well as policies and resources aimed to address them.
Difficulty level: Beginner
Duration: 18:13
Speaker: : Mojib Javadi

This lesson provides an overview of how to manage relationships in a research context, while highlighting the need for effective communication at various levels.
Difficulty level: Beginner
Duration:
Speaker: : Helena Ledmyr

Manipulate the default connectome provided with TVB to see how structural lesions effect brain dynamics. In this hands-on session you will insert lesions into the connectome within the TVB graphical user interface (GUI). Afterwards, the modified connectome will be used for simulations and the resulting activity will be analysed using functional connectivity.
Difficulty level: Beginner
Duration: 31:22
Speaker: : Paul Triebkorn

Research Resource Identifiers (RRIDs) are ID numbers assigned to help researchers cite key resources (e.g., antibodies, model organisms, and software projects) in biomedical literature to improve the transparency of research methods.
Difficulty level: Beginner
Duration: 1:01:36
Speaker: : Maryann Martone

This lecture provides an introduction to the Brain Imaging Data Structure (BIDS), a standard for organizing human neuroimaging datasets.
Difficulty level: Intermediate
Duration: 56:49
Speaker: : Chris Gorgolewski

Course:
This lecture covers the rationale for developing the DAQCORD, a framework for the design, documentation, and reporting of data curation methods in order to advance the scientific rigour, reproducibility, and analysis of data.
Difficulty level: Intermediate
Duration: 17:08
Speaker: : Ari Ercole

In this lesson, you will learn in more detail about neuromorphic computing, that is, non-standard computational architectures that mimic some aspect of the way the brain works.
Difficulty level: Intermediate
Duration: 10:08
Speaker: : Dan Goodman

This video provides a very quick introduction to some of the neuromorphic sensing devices, and how they offer unique, low-power applications.
Difficulty level: Intermediate
Duration: 2:37
Speaker: : Dan Goodman

Course:
This lecture covers FAIR atlases, including their background and construction, as well as how they can be created in line with the FAIR principles.
Difficulty level: Beginner
Duration: 14:24
Speaker: : Heidi Kleven

Course:
This lesson is a general overview of overarching concepts in neuroinformatics research, with a particular focus on clinical approaches to defining, measuring, studying, diagnosing, and treating various brain disorders. Also described are the complex, multi-level nature of brain disorders and the data associated with them, from genes and individual cells up to cortical microcircuits and whole-brain network dynamics. Given the heterogeneity of brain disorders and their underlying mechanisms, this lesson lays out a case for multiscale neuroscience data integration.
Difficulty level: Intermediate
Duration: 1:09:33
Speaker: : Sean Hill

This lesson gives an in-depth introduction of ethics in the field of artificial intelligence, particularly in the context of its impact on humans and public interest. As the healthcare sector becomes increasingly affected by the implementation of ever stronger AI algorithms, this lecture covers key interests which must be protected going forward, including privacy, consent, human autonomy, inclusiveness, and equity.
Difficulty level: Beginner
Duration: 1:22:06
Speaker: : Daniel Buchman

This is a continuation of the talk on the cellular mechanisms of neuronal communication, this time at the level of brain microcircuits and associated global signals like those measureable by electroencephalography (EEG). This lecture also discusses EEG biomarkers in mental health disorders, and how those cortical signatures may be simulated digitally.
Difficulty level: Intermediate
Duration: 1:11:04
Speaker: : Etay Hay
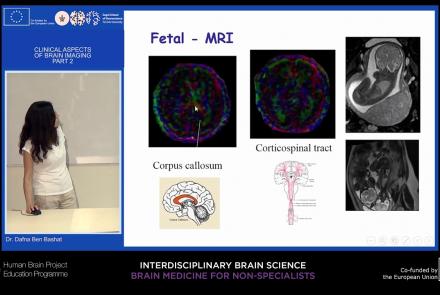
This lecture picks up from the previous lesson, providing an overview of neuroimaging techniques and their clinical applications.
Difficulty level: Beginner
Duration: 41:00
Speaker: : Dafna Ben Bashat

This lesson provides a basic introduction to clinical presentation of schizophrenia, its etiology, and current treatment options.
Difficulty level: Beginner
Duration: 51:49
Speaker: : Wolfgang Fleischhacker

This lecture focuses on the rationale for employing neuroimaging methods for movement disorders.
Difficulty level: Beginner
Duration: 1:04:04
Speaker: : Bogdan Draganski

This lecture provides an introduction to entropy in general, and multi-scale entropy (MSE) in particular, highlighting the potential clinical applications of the latter.
Difficulty level: Intermediate
Duration: 39:05
Speaker: : Jil Meier

Course:
This tutorial demonstrates how to work with neuronal data using MATLAB, including actional potentials and spike counts, orientation tuing curves in visual cortex, and spatial maps of firing rates.
Difficulty level: Intermediate
Duration: 5:17
Speaker: : Mike X. Cohen

Course:
In this lesson, users will learn how to appropriately sort and bin neural spikes, allowing for the generation of a common and powerful visualization tool in neuroscience, the histogram.
Difficulty level: Intermediate
Duration: 5:31
Speaker: : Mike X. Cohen

Course:
Followers of this lesson will learn how to compute, visualize and quantify the tuning curves of individual neurons.
Difficulty level: Intermediate
Duration: 13:48
Speaker: : Mike X. Cohen