Lesson type
Difficulty level

This short talk addresses how to use VisuAlign to make nonlinear adjustments to 2D-to-3D registrations generated by QuickNII.
Difficulty level: Beginner
Duration: 08:50
Speaker: : Maja Puchades

This talk aims to provide guidance regarding the myriad labelling methods for histological image data.
Difficulty level: Beginner
Duration: 35:20
Speaker: : Sharon Yates

This lesson provides a cross-species comparison of neuron types in the rat and mouse brain.
Difficulty level: Beginner
Duration: 17:16
Speaker: : Ingvild Elise Bjerke

This lecture concludes the course with an outline of future directions of the field of neuroscientific research data integration.
Difficulty level: Beginner
Duration: 09:49
Speaker: : Jan G. Bjaalie

Course:
Overview of the content for Day 1 of this course.
Difficulty level: Beginner
Duration: 00:01:59
Speaker: : Tristan Shuman

Course:
Overview of Day 2 of this course.
Difficulty level: Beginner
Duration: 00:03:28
Speaker: : Tristan Shuman

Course:
This tutorial demonstrates how to work with neuronal data using MATLAB, including actional potentials and spike counts, orientation tuing curves in visual cortex, and spatial maps of firing rates.
Difficulty level: Intermediate
Duration: 5:17
Speaker: : Mike X. Cohen

Course:
This lesson instructs users on how to import electrophysiological neural data into MATLAB, as well as how to convert spikes to a data matrix.
Difficulty level: Intermediate
Duration: 11:37
Speaker: : Mike X. Cohen

Course:
In this lesson, users will learn how to appropriately sort and bin neural spikes, allowing for the generation of a common and powerful visualization tool in neuroscience, the histogram.
Difficulty level: Intermediate
Duration: 5:31
Speaker: : Mike X. Cohen

Course:
Followers of this lesson will learn how to compute, visualize and quantify the tuning curves of individual neurons.
Difficulty level: Intermediate
Duration: 13:48
Speaker: : Mike X. Cohen

Course:
This lesson demonstrates how to programmatically generate a spatial map of neuronal spike counts using MATLAB.
Difficulty level: Intermediate
Duration: 12:16
Speaker: : Mike X. Cohen

Course:
In this lesson, users are shown how to create a spatial map of neuronal orientation tuning.
Difficulty level: Intermediate
Duration: 13:11
Speaker: : Mike X. Cohen

Course:
Best practices: the tips and tricks on how to get your Miniscope to work and how to get your experiments off the ground.
Difficulty level: Beginner
Duration: 00:53:34

Course:
This talk compares various sensors and resolutions for in vivo neural recordings.
Difficulty level: Beginner
Duration: 00:24:03
Speaker: : Susie Feng, Zach Pennington, Caleb Kemere
Course:
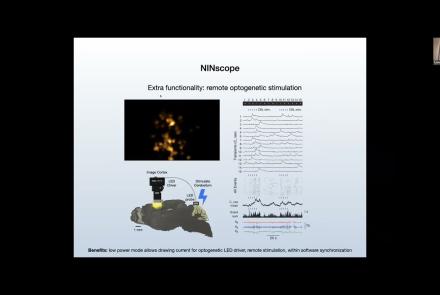
This talk delves into challenges and opportunities of Miniscope design, seeking the optimal balance between scale and function.
Difficulty level: Beginner
Duration: 00:21:51
Speaker: : Susie Feng, Zach Pennington, Tycho Hoogland

Course:
Attendees of this talk will learn aobut computational imaging systems and associated pipelines, as well as open-source software solutions supporting miniscope use.
Difficulty level: Beginner
Duration: 00:17:56
Speaker: : Susie Feng, Zach Pennington, Laura Waller

Course:
This lecture introduces neuroscience concepts and methods such as fMRI, visual respones in BOLD data, and the eccentricity of visual receptive fields.
Difficulty level: Intermediate
Duration: 7:15
Speaker: : Mike X. Cohen

Course:
This tutorial walks users through the creation and visualization of activation flat maps from fMRI datasets.
Difficulty level: Intermediate
Duration: 12:15
Speaker: : Mike X. Cohen

Course:
This talk covers the present state and future directions of calcium imaging data analysis, particularly in the context of one-photon vs two-photon approaches.
Difficulty level: Beginner
Duration: 00:21:06

Course:
This tutorial demonstrates to users the conventional preprocessing steps when working with BOLD signal datasets from fMRI.
Difficulty level: Intermediate
Duration: 12:05
Speaker: : Mike X. Cohen