Lesson type
Difficulty level

Course:
This hands-on tutorial explains how to run your own Minion session in the MetaCell cloud using jupityr notebooks.
Difficulty level: Beginner
Duration: 01:28:03
Speaker: : Daniel Aharoni, Phil Dong

This hands-on tutorial walks you through DataJoint platform, highlighting features and schema which can be used to build robost neuroscientific pipelines.
Difficulty level: Beginner
Duration: 26:06
Speaker: : Milagros Marin

In this hands-on session, you will learn how to explore and work with DataLad datasets, containers, and structures using Jupyter notebooks.
Difficulty level: Beginner
Duration: 58:05
Speaker: : Michał Szczepanik

This tutorial provides instruction on how to simulate brain tumors with TVB (reproducing publication: Marinazzo et al. 2020 Neuroimage). This tutorial comprises a didactic video, jupyter notebooks, and full data set for the construction of virtual brains from patients and health controls.
Difficulty level: Intermediate
Duration: 10:01

The tutorial on modelling strokes in TVB includes a didactic video and jupyter notebooks (reproducing publication: Falcon et al. 2016 eNeuro).
Difficulty level: Intermediate
Duration: 7:43

This lecture covers concepts associated with neural nets, including rotation and squashing, and is a part of the Deep Learning Course at New York University's Center for Data Science (CDS).
Difficulty level: Intermediate
Duration: 1:01:53
Speaker: : Alfredo Canziani

This lecture covers the concept of neural nets training (tools, classification with neural nets, and PyTorch implementation) and is a part of the Deep Learning Course at NYU's Center for Data Science.
Difficulty level: Intermediate
Duration: 1:05:47
Speaker: : Alfredo Canziani

This lecture discusses the concept of natural signals properties and the convolutional nets in practice and is a part of the Deep Learning Course at NYU's Center for Data Science.
Difficulty level: Intermediate
Duration: 1:09:12
Speaker: : Alfredo Canziani

This lecture covers the concept of recurrent neural networks: vanilla and gated (LSTM) and is a part of the Deep Learning Course at NYU's Center for Data Science.
Difficulty level: Intermediate
Duration: 1:05:36
Speaker: : Alfredo Canziani

This tutorial covers LV-EBM to target prop to (vanilla, denoising, contractive, variational) autoencoder and is a part of the Advanced Energy-Based Models module of the the Deep Learning Course at NYU's Center for Data Science. Prerequisites for this course include: Energy-Based Models I, Energy-Based Models II, Energy-Based Models III, Energy-Based Models IV, and an Introduction to Data Science or a Graduate Level Machine Learning course.
Difficulty level: Advanced
Duration: 1:00:34
Speaker: : Alfredo Canziani
This tutorial covers the concepts of autoencoders, denoising encoders, and variational autoencoders (VAE) with PyTorch, as well as generative adversarial networks and code. It is a part of the Advanced energy based models modules of the the Deep Learning Course at NYU's Center for Data Science. Prerequisites for this course include: Energy-Based Models I, Energy-Based Models II, Energy-Based Models III, Energy-Based Models IV, Energy-Based Models V, and an Introduction to Data Science or a Graduate Level Machine Learning course.
Difficulty level: Advanced
Duration: 1:07:50
Speaker: : Alfredo Canziani

This tutorial covers advanced concept of energy-based models. The lecture is a part of the Associative Memories module of the the Deep Learning Course at NYU's Center for Data Science.
Difficulty level: Advanced
Duration: 1:12:00
Speaker: : Alfredo Canziani

Course:
This tutuorial covers the concept of graph convolutional networks and is a part of the Deep Learning Course at NYU's Center for Data Science. Prerequisites for this module include: Modules 1 - 5 of this course and an Introduction to Data Science or a Graduate Level Machine Learning course.
Difficulty level: Advanced
Duration: 57:33
Speaker: : Alfredo Canziani

Course:
This lecture covers the concepts of emulation of kinematics from observations and training a policy. It is a part of the Deep Learning Course at NYU's Center for Data Science. Prerequisites for this module include: Models 1-6 of this course and an Introduction to Data Science or a Graduate Level Machine Learning course.
Difficulty level: Advanced
Duration: 1:01:21
Speaker: : Alfredo Canziani
Course:
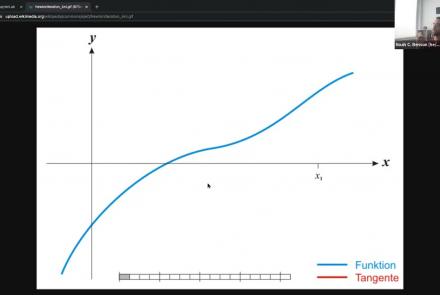
As a part of NeuroHackademy 2021, Noah Benson gives an introduction to Pytorch, one of the two most common software packages for deep learning applications to the neurosciences.
Difficulty level: Beginner
Duration: 00:50:40
Speaker: :

Course:
In this hands-on tutorial, Dr. Robert Guangyu Yang works through a number of coding exercises to see how RNNs can be easily used to study cognitive neuroscience questions, with a quick demonstration of how we can train and analyze RNNs on various cognitive neuroscience tasks. Familiarity of Python and basic knowledge of Pytorch are assumed.
Difficulty level: Beginner
Duration: 00:26:38
Speaker: :

Course:
An introduction to data management, manipulation, visualization, and analysis for neuroscience. Students will learn scientific programming in Python, and use this to work with example data from areas such as cognitive-behavioral research, single-cell recording, EEG, and structural and functional MRI. Basic signal processing techniques including filtering are covered. The course includes a Jupyter Notebook and video tutorials.
Difficulty level: Beginner
Duration: 1:09:16
Speaker: : Aaron J. Newman
Course:
This book was written with the goal of introducing researchers and students in a variety of research fields to the intersection of data science and neuroimaging. This book reflects our own experience of doing research at the intersection of data science and neuroimaging and it is based on our experience working with students and collaborators who come from a variety of backgrounds and have a variety of reasons for wanting to use data science approaches in their work. The tools and ideas that we chose to write about are all tools and ideas that we have used in some way in our own research. Many of them are tools that we use on a daily basis in our work. This was important to us for a few reasons: the first is that we want to teach people things that we ourselves find useful. Second, it allowed us to write the book with a focus on solving specific analysis tasks. For example, in many of the chapters you will see that we walk you through ideas while implementing them in code, and with data. We believe that this is a good way to learn about data analysis, because it provides a connecting thread from scientific questions through the data and its representation to implementing specific answers to these questions. Finally, we find these ideas compelling and fruitful. That’s why we were drawn to them in the first place. We hope that our enthusiasm about the ideas and tools described in this book will be infectious enough to convince the readers of their value.
Difficulty level: Intermediate
Duration:
Speaker: :
Course:
This Jupyter Book is a series of interactive tutorials about quantitative T1 mapping, powered by qMRLab. Most figures are generated with Plot.ly – you can play with them by hovering your mouse over the data, zooming in (click and drag) and out (double click), moving the sliders, and changing the drop-down options. To view the code that was used to generate the figures in this blog post, hover your cursor in the top left corner of the frame that contains the tutorial and click the checkbox “All cells” in the popup that appears.
Jupyter Lab notebooks of these tutorials are also available through MyBinder, and inline code modification inside the Jupyter Book is provided by Thebelab. For both options, you can modify the code, change the figures, and regenerate the html that was used to create the tutorial below. This Jupyter Book also uses a Script of Scripts (SoS) kernel, allowing us to process the data using qMRLab in MATLAB/Octave and plot the figures with Plot.ly using Python, all within the same Jupyter Notebook.
Difficulty level: Intermediate
Duration:
Speaker: :