Lesson type
Difficulty level

Course:
In this lesson, users will learn about human brain signals as measured by electroencephalography (EEG), as well as associated neural signatures such as steady state visually evoked potentials (SSVEPs) and alpha oscillations.
Difficulty level: Intermediate
Duration: 8:51
Speaker: : Mike X. Cohen

This lecture presents the Medical Informatics Platform's data federation in epilepsy.
Difficulty level: Intermediate
Duration: 27:09
Speaker: : Philippe Ryvlin

This lesson is an overview of transcriptomics, from fundamental concepts of the central dogma and RNA sequencing at the single-cell level, to how genetic expression underlies diversity in cell phenotypes.
Difficulty level: Intermediate
Duration: 1:29:08
Speaker: : Shreejoy Tripathy

This is a continuation of the talk on the cellular mechanisms of neuronal communication, this time at the level of brain microcircuits and associated global signals like those measureable by electroencephalography (EEG). This lecture also discusses EEG biomarkers in mental health disorders, and how those cortical signatures may be simulated digitally.
Difficulty level: Intermediate
Duration: 1:11:04
Speaker: : Etay Hay

This is an in-depth guide on EEG signals and their interaction within brain microcircuits. Participants are also shown techniques and software for simulating, analyzing, and visualizing these signals.
Difficulty level: Intermediate
Duration: 1:30:41
Speaker: : Frank Mazza

Course:
In this tutorial on simulating whole-brain activity using Python, participants can follow along using corresponding code and repositories, learning the basics of neural oscillatory dynamics, evoked responses and EEG signals, ultimately leading to the design of a network model of whole-brain anatomical connectivity.
Difficulty level: Intermediate
Duration: 1:16:10
Speaker: : John Griffiths

This lesson breaks down the principles of Bayesian inference and how it relates to cognitive processes and functions like learning and perception. It is then explained how cognitive models can be built using Bayesian statistics in order to investigate how our brains interface with their environment.
This lesson corresponds to slides 1-64 in the PDF below.
Difficulty level: Intermediate
Duration: 1:28:14
Speaker: : Andreea Diaconescu

In this third and final hands-on tutorial from the Research Workflows for Collaborative Neuroscience workshop, you will learn about workflow orchestration using open source tools like DataJoint and Flyte.
Difficulty level: Intermediate
Duration: 22:36
Speaker: : Daniel Xenes

This lecture aims to help researchers, students, and health care professionals understand the place for neuroinformatics in the patient journey using the exemplar of an epilepsy patient.
Difficulty level: Intermediate
Duration: 1:32:53
Speaker: : Randy Gollub & Prantik Kundu

This lesson continues from part one of the lecture Ontologies, Databases, and Standards, diving deeper into a description of ontologies and knowledg graphs.
Difficulty level: Intermediate
Duration: 50:18
Speaker: : Jeff Grethe

This lecture describes how to build research workflows, including a demonstrate using DataJoint Elements to build data pipelines.
Difficulty level: Intermediate
Duration: 47:00
Speaker: : Dimitri Yatsenko

This tutorial provides instruction on how to simulate brain tumors with TVB (reproducing publication: Marinazzo et al. 2020 Neuroimage). This tutorial comprises a didactic video, jupyter notebooks, and full data set for the construction of virtual brains from patients and health controls.
Difficulty level: Intermediate
Duration: 10:01

The tutorial on modelling strokes in TVB includes a didactic video and jupyter notebooks (reproducing publication: Falcon et al. 2016 eNeuro).
Difficulty level: Intermediate
Duration: 7:43
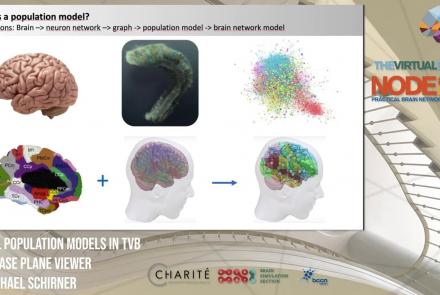
This lesson introduces population models and the phase plane, and is part of the The Virtual Brain (TVB) Node 10 Series, a 4-day workshop dedicated to learning about the full brain simulation platform TVB, as well as brain imaging, brain simulation, personalised brain models, and TVB use cases.
Difficulty level: Intermediate
Duration: 1:10:41
Speaker: : Michael Schirner

This lesson introduces TVB-multi-scale extensions and other TVB tools which facilitate modeling and analyses of multi-scale data.
Difficulty level: Intermediate
Duration: 36:10
Speaker: : Dionysios Perdikis

This lecture delves into cortical (i.e., surface-based) brain simulations, as well as subcortical (i.e., deep brain) stimulations, covering the definitions, motivations, and implementations of both.
Difficulty level: Intermediate
Duration: 39:05
Speaker: : Jil Meier

This lecture provides an introduction to entropy in general, and multi-scale entropy (MSE) in particular, highlighting the potential clinical applications of the latter.
Difficulty level: Intermediate
Duration: 39:05
Speaker: : Jil Meier

This lecture gives an overview of how to prepare and preprocess neuroimaging (EEG/MEG) data for use in TVB.
Difficulty level: Intermediate
Duration: 1:40:52
Speaker: : Paul Triebkorn

In this lecture, you will learn about various neuroinformatic resources which allow for 3D reconstruction of brain models.
Difficulty level: Intermediate
Duration: 1:36:57
Speaker: : Michael Schirner
Course:
This book was written with the goal of introducing researchers and students in a variety of research fields to the intersection of data science and neuroimaging. This book reflects our own experience of doing research at the intersection of data science and neuroimaging and it is based on our experience working with students and collaborators who come from a variety of backgrounds and have a variety of reasons for wanting to use data science approaches in their work. The tools and ideas that we chose to write about are all tools and ideas that we have used in some way in our own research. Many of them are tools that we use on a daily basis in our work. This was important to us for a few reasons: the first is that we want to teach people things that we ourselves find useful. Second, it allowed us to write the book with a focus on solving specific analysis tasks. For example, in many of the chapters you will see that we walk you through ideas while implementing them in code, and with data. We believe that this is a good way to learn about data analysis, because it provides a connecting thread from scientific questions through the data and its representation to implementing specific answers to these questions. Finally, we find these ideas compelling and fruitful. That’s why we were drawn to them in the first place. We hope that our enthusiasm about the ideas and tools described in this book will be infectious enough to convince the readers of their value.
Difficulty level: Intermediate
Duration:
Speaker: :