Lesson type
Difficulty level

This talk describes the relevance and power of using brain atlases as part of one's data integration pipeline.
Difficulty level: Beginner
Duration: 15:37
Speaker: : Timo Dickscheid

In this hands-on session, you will learn how to explore and work with DataLad datasets, containers, and structures using Jupyter notebooks.
Difficulty level: Beginner
Duration: 58:05
Speaker: : Michał Szczepanik

This lesson provides a thorough description of neuroimaging development over time, both conceptually and technologically. You will learn about the fundamentals of imaging techniques such as MRI and PET, as well as how the resultant data may be used to generate novel data visualization schemas.
Difficulty level: Beginner
Duration: 1:43:57
Speaker: : Jack Van Horn

This lecture covers a wide range of aspects regarding neuroinformatics and data governance, describing both their historical developments and current trajectories. Particular tools, platforms, and standards to make your research more FAIR are also discussed.
Difficulty level: Beginner
Duration: 54:58
Speaker: : Franco Pestilli

Course:
This video will demonstrate how to create and launch a pipeline using FreeSurfer on brainlife.io.
Difficulty level: Beginner
Duration: 0:25
Speaker: :

Course:
This lecture covers the description and characterization of an input-output relationship in a information-theoretic context.
Difficulty level: Beginner
Duration: 1:35:33
Speaker: : Jonathan D. Victor

Course:
In this tutorial, you will learn the basic features of uploading and versioning your data within OpenNeuro.org.
Difficulty level: Beginner
Duration: 5:36
Speaker: : OpenNeuro
Course:
This tutorial shows how to share your data in OpenNeuro.org.
Difficulty level: Beginner
Duration: 1:22
Speaker: : OpenNeuro

Course:
Following the previous two tutorials on uploading and sharing data with OpenNeuro.org, this tutorial briefly covers how to run various analyses on your datasets.
Difficulty level: Beginner
Duration: 2:26
Speaker: : OpenNeuro

Course:
This lesson provides instruction on how to infer results from incomplete data.
Difficulty level: Beginner
Duration: 4:28
Speaker: : Barton Poulson

Course:
This lesson provides instruction on finding parameter values, computing confidence levels, and other various statistical methods employed in data investigation.
Difficulty level: Beginner
Duration: 08:04
Speaker: : Barton Poulson

Course:
In this lesson, statistical methods and tools are described for estimating parameters in your dataset.
Difficulty level: Beginner
Duration: 5:29
Speaker: : Barton Poulson

Course:
This lesson covers how to measure the correspondece between data and model.
Difficulty level: Beginner
Duration: 3:30
Speaker: : Barton Poulson

Course:
In this lesson, you will learn the concepts behind choosing useful variables, as well as various analyses and tools to do so.
Difficulty level: Beginner
Duration: 6:15
Speaker: : Barton Poulson
Course:
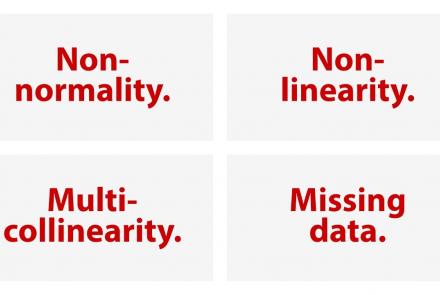
This lesson goes over some of the common problems in statistical modeling.
Difficulty level: Beginner
Duration: 5:58
Speaker: : Barton Poulson

Course:
This lesson continues describing some of the common problems in statistical modelling, particularly when it comes to model validation.
Difficulty level: Beginner
Duration: 3:50
Speaker: : Barton Poulson

Course:
You don't have to be a wizard to do statistics!
Difficulty level: Beginner
Duration: 3:18
Speaker: : Barton Poulson

Course:
This lesson provides an overview of possible follow-up courses and subjects from the same publisher.
Difficulty level: Beginner
Duration: 1:43
Speaker: : Barton Poulson

This talk highlights a set of platform technologies, software, and data collections that close and shorten the feedback cycle in research.
Difficulty level: Beginner
Duration: 57:52
Speaker: : Satrajit Ghosh

Course:
This lesson gives a quick walkthrough the Tidyverse, an "opinionated" collection of R packages designed for data science, including the use of readr, dplyr, tidyr, and ggplot2.
Difficulty level: Beginner
Duration: 1:01:39
Speaker: : Thomas Mock