Lesson type
Difficulty level

This lesson continues with the second workshop on reproducible science, focusing on additional open source tools for researchers and data scientists, such as the R programming language for data science, as well as associated tools like RStudio and R Markdown. Additionally, users are introduced to Python and iPython notebooks, Google Colab, and are given hands-on tutorials on how to create a Binder environment, as well as various containers in Docker and Singularity.
Difficulty level: Beginner
Duration: 1:16:04
Speaker: : Erin Dickie and Sejal Patel

This lesson provides a short reel on who we are, what we're doing and why we're doing it.
Difficulty level: Beginner
Duration: 2:38
Speaker: :

In this webinar, educators currently implementing collaborative annotation in their classrooms discuss their experiences with collaborative annotation and using Hythothes.is and Canvas App.
Difficulty level: Beginner
Duration: 53:14
Speaker: : Jeremy Dean

This tutorial provides an overview of how to use the feature of Hypothes.is.
Difficulty level: Beginner
Duration: 09:30
Speaker: :

This lesson gives a brief overview of the Hypothes.is functionality from an end user's perspective.
Difficulty level: Beginner
Duration: 5:36
Speaker: : Heather Staines

Course:
This video will teach you the basics of navigating the Open Science Framework and creating your first projects.
Difficulty level: Beginner
Duration: 2:11
Speaker: :

Course:
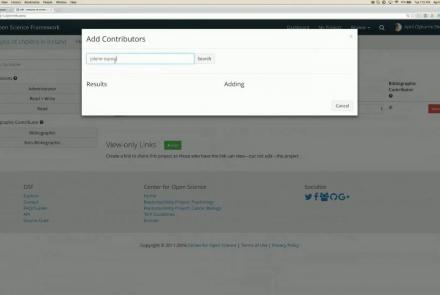
This webinar walks you through the basics of creating an OSF project, structuring it to fit your research needs, adding collaborators, and tying your favorite online tools into your project structure.
Difficulty level: Beginner
Duration: 55:02
Speaker: : Ian Sullivan
Course:
This webinar will introduce how to use the Open Science Framework (OSF) in a classroom setting.
Difficulty level: Beginner
Duration: 32:01
Speaker: : April Clyburne-Sherin

Course:
This lesson provides instruction on how to organize related projects with OSF features such as links, forks, and templates.
Difficulty level: Beginner
Duration: 51:14
Speaker: : Ian Sullivan

This webinar will introduce the integration of JASP Statistical Software with the Open Science Framework (OSF).
Difficulty level: Beginner
Duration: 30:56
Speaker: : Alexander Etz

Course:
This lesson describes the value of version control, as well as how to do so with your own files and data on OSF.
Difficulty level: Beginner
Duration: 22:07
Speaker: : Courtney Soderberg

Course:
This lecture focuses on where and how Jupyter notebooks can be used most effectively for education.
Difficulty level: Beginner
Duration: 34:53
Speaker: : Thomas Kluyver

Course:
JupyterHub is a simple, highly extensible, multi-user system for managing per-user Jupyter Notebook servers, designed for research groups or classes. This lecture covers deploying JupyterHub on a single server, as well as deploying with Docker using GitHub for authentication.
Difficulty level: Beginner
Duration: 1:36:27
Speaker: : Thomas Kluyver

Course:
In this lecture, attendees will learn how Mutant Mouse Resource and Research Center (MMRRC) archives, cryopreserves, and distributes scientifically valuable genetically engineered mouse strains and mouse ES cell lines for the genetics and biomedical research community.
Difficulty level: Beginner
Duration: 43:38
Speaker: : Kent Lloyd

Course:
This talk deals with Identifiers.org, a central infrastructure for findable, accessible, interoperable and re-usable (FAIR) data, which provides a range of services to promote the citability of individual data providers and integration with e-infrastructures.
Difficulty level: Beginner
Duration: 36:41
Speaker: : Sarala Wimalaratne

Course:
This lecture provides an overview of the technology and demonstration of how Hypothes.is is being used within biomedicine.
Difficulty level: Beginner
Duration: 52:06
Speaker: : Maryann Martone

Course:
This demonstration walks through how to import your data into MATLAB.
Difficulty level: Beginner
Duration: 6:10
Speaker: : MATLAB®

Course:
This lesson provides instruction regarding the various factors one must consider when preprocessing data, preparing it for statistical exploration and analyses.
Difficulty level: Beginner
Duration: 15:10
Speaker: : MATLAB®

Course:
This tutorial outlines, step by step, how to perform analysis by group and how to do change-point detection.
Difficulty level: Beginner
Duration: 2:49
Speaker: : MATLAB®

Course:
This tutorial walks through several common methods for visualizing your data in different ways depending on your data type.
Difficulty level: Beginner
Duration: 6:10
Speaker: : MATLAB®