Lesson type
Difficulty level

This talk covers the differences between applying HED annotation to fMRI datasets versus other neuroimaging practices, and also introduces an analysis pipeline using HED tags.
Difficulty level: Beginner
Duration: 22:52
Speaker: : Monique Denissen

Manipulate the default connectome provided with TVB to see how structural lesions effect brain dynamics. In this hands-on session you will insert lesions into the connectome within the TVB graphical user interface (GUI). Afterwards, the modified connectome will be used for simulations and the resulting activity will be analysed using functional connectivity.
Difficulty level: Beginner
Duration: 31:22
Speaker: : Paul Triebkorn

Course:
In this lesson you will learn how to simulate seizure events and epilepsy in The Virtual Brain. We will look at the paper On the Nature of Seizure Dynamics, which describes a new local model called the Epileptor, and apply this same model in The Virtual Brain. This is part 1 of 2 in a series explaining how to use the Epileptor. In this part, we focus on setting up the parameters.
Difficulty level: Beginner
Duration: 4:44
Speaker: : Paul Triebkorn

Course:
This lesson provides an overview of GeneWeaver, a web application for the integrated cross-species analysis of functional genomics data to find convergent evidence from heterogeneous sources.
Difficulty level: Beginner
Duration: 1:03:26
Speaker: : Erich J. Baker

Course:
This lesson provides a demonstration of GeneWeaver, a system for the integration and analysis of heterogeneous functional genomics data.
Difficulty level: Beginner
Duration: 25:53
Speaker: :

Course:
Longitudinal Online Research and Imaging System (LORIS) is a web-based data and project management software for neuroimaging research studies. It is an open source framework for storing and processing behavioural, clinical, neuroimaging and genetic data. LORIS also makes it easy to manage large datasets acquired over time in a longitudinal study, or at different locations in a large multi-site study.
Difficulty level: Beginner
Duration: 0:35
Speaker: : Samir Das

This talk highlights a set of platform technologies, software, and data collections that close and shorten the feedback cycle in research.
Difficulty level: Beginner
Duration: 57:52
Speaker: : Satrajit Ghosh

Course:
This lecture outlines GeneNetwork.org, a group of linked data sets and tools used to study complex networks of genes, molecules, and higher order gene function and phenotypes.
Difficulty level: Beginner
Duration: 1:00:43
Speaker: : Robert Williams

Course:
This talk covers the Neuroimaging Informatics Tools and Resources Clearinghouse (NITRC), a free one-stop-shop collaboratory for science researchers that need resources such as neuroimaging analysis software, publicly available data sets, or computing power.
Difficulty level: Beginner
Duration: 1:00:10
Speaker: : David Kennedy

Course:
This lesson introduces the EEGLAB toolbox, as well as motivations for its use.
Difficulty level: Beginner
Duration: 15:32
Speaker: : Arnaud Delorme
Course:
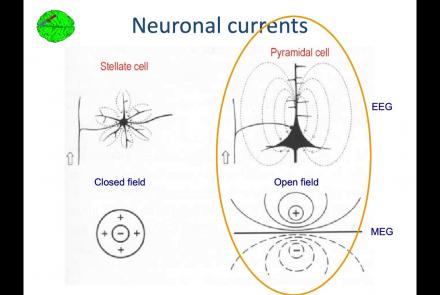
In this lesson, you will learn about the biological activity which generates and is measured by the EEG signal.
Difficulty level: Beginner
Duration: 6:53
Speaker: : Arnaud Delorme

Course:
This lesson goes over the characteristics of EEG signals when analyzed in source space (as opposed to sensor space).
Difficulty level: Beginner
Duration: 10:56
Speaker: : Arnaud Delorme

Course:
This lesson describes the development of EEGLAB as well as to what extent it is used by the research community.
Difficulty level: Beginner
Duration: 6:06
Speaker: : Arnaud Delorme

Course:
This lesson provides instruction as to how to build a processing pipeline in EEGLAB for a single participant.
Difficulty level: Beginner
Duration: 9:20
Speaker: :

Course:
Whereas the previous lesson of this course outlined how to build a processing pipeline for a single participant, this lesson discusses analysis pipelines for multiple participants simultaneously.
Difficulty level: Beginner
Duration: 10:55
Speaker: : Arnaud Delorme

Course:
In addition to outlining the motivations behind preprocessing EEG data in general, this lesson covers the first step in preprocessing data with EEGLAB, importing raw data.
Difficulty level: Beginner
Duration: 8:30
Speaker: : Arnaud Delorme

Course:
Continuing along the EEGLAB preprocessing pipeline, this tutorial walks users through how to import data events as well as EEG channel locations.
Difficulty level: Beginner
Duration: 11:53
Speaker: : Arnaud Delorme

Course:
This tutorial instructs users how to visually inspect partially pre-processed neuroimaging data in EEGLAB, specifically how to use the data browser to investigate specific channels, epochs, or events for removable artifacts, biological (e.g., eye blinks, muscle movements, heartbeat) or otherwise (e.g., corrupt channel, line noise).
Difficulty level: Beginner
Duration: 5:08
Speaker: : Arnaud Delorme

Course:
This tutorial provides instruction on how to use EEGLAB to further preprocess EEG datasets by identifying and discarding bad channels which, if left unaddressed, can corrupt and confound subsequent analysis steps.
Difficulty level: Beginner
Duration: 13:01
Speaker: : Arnaud Delorme

Course:
Users following this tutorial will learn how to identify and discard bad EEG data segments using the MATLAB toolbox EEGLAB.
Difficulty level: Beginner
Duration: 11:25
Speaker: : Arnaud Delorme