Lesson type
Difficulty level

In this lesson, the simulation of a virtual epileptic patient is presented as an example of advanced brain simulation as a translational approach to deliver improved clinical results. You will learn about the fundamentals of epilepsy, as well as the concepts underlying epilepsy simulation. By using an iPython notebook, the detailed process of this approach is explained step by step. In the end, you are able to perform simple epilepsy simulations your own.
Difficulty level: Beginner
Duration: 1:28:53
Speaker: : Julie Courtiol

Course:
In this lesson you will learn how to simulate seizure events and epilepsy in The Virtual Brain. We will look at the paper On the Nature of Seizure Dynamics, which describes a new local model called the Epileptor, and apply this same model in The Virtual Brain. This is part 1 of 2 in a series explaining how to use the Epileptor. In this part, we focus on setting up the parameters.
Difficulty level: Beginner
Duration: 4:44
Speaker: : Paul Triebkorn

Manipulate the default connectome provided with TVB to see how structural lesions effect brain dynamics. In this hands-on session you will insert lesions into the connectome within the TVB graphical user interface (GUI). Afterwards, the modified connectome will be used for simulations and the resulting activity will be analysed using functional connectivity.
Difficulty level: Beginner
Duration: 31:22
Speaker: : Paul Triebkorn

This talk highlights a set of platform technologies, software, and data collections that close and shorten the feedback cycle in research.
Difficulty level: Beginner
Duration: 57:52
Speaker: : Satrajit Ghosh

Course:
This lesson provides an overview of the database of Genotypes and Phenotypes (dbGaP), which was developed to archive and distribute the data and results from studies that have investigated the interaction of genotype and phenotype in humans.
Difficulty level: Beginner
Duration: 48:22
Speaker: : Michael Feolo

This opening lecture from INCF's Short Course in Neuroinformatics provides an overview of the field of neuroinformatics itself, as well as laying out an argument for the necessity for developing more sophisticated approaches towards FAIR data management principles in neuroscience.
Difficulty level: Beginner
Duration: 1:19:14
Speaker: : Maryann Martone

This lesson aims to define computational neuroscience in general terms, while providing specific examples of highly successful computational neuroscience projects.
Difficulty level: Beginner
Duration: 59:21
Speaker: : Alla Borisyuk

This lecture covers a wide range of aspects regarding neuroinformatics and data governance, describing both their historical developments and current trajectories. Particular tools, platforms, and standards to make your research more FAIR are also discussed.
Difficulty level: Beginner
Duration: 54:58
Speaker: : Franco Pestilli

Course:
Presented by the OHBM OpenScienceSIG, this lesson covers how containers can be useful for running the same software on different platforms and sharing analysis pipelines with other researchers.
Difficulty level: Beginner
Duration: 01:21:59
Speaker: : Tom Shaw & Steffen Bollmann

This lesson continues with the second workshop on reproducible science, focusing on additional open source tools for researchers and data scientists, such as the R programming language for data science, as well as associated tools like RStudio and R Markdown. Additionally, users are introduced to Python and iPython notebooks, Google Colab, and are given hands-on tutorials on how to create a Binder environment, as well as various containers in Docker and Singularity.
Difficulty level: Beginner
Duration: 1:16:04
Speaker: : Erin Dickie and Sejal Patel

This lesson contains both a lecture and a tutorial component. The lecture (0:00-20:03 of YouTube video) discusses both the need for intersectional approaches in healthcare as well as the impact of neglecting intersectionality in patient populations. The lecture is followed by a practical tutorial in both Python and R on how to assess intersectional bias in datasets. Links to relevant code and data are found below.
Difficulty level: Beginner
Duration: 52:26

This lesson provides a thorough description of neuroimaging development over time, both conceptually and technologically. You will learn about the fundamentals of imaging techniques such as MRI and PET, as well as how the resultant data may be used to generate novel data visualization schemas.
Difficulty level: Beginner
Duration: 1:43:57
Speaker: : Jack Van Horn

Course:
In this tutorial, you will learn the basic features of uploading and versioning your data within OpenNeuro.org.
Difficulty level: Beginner
Duration: 5:36
Speaker: : OpenNeuro
Course:
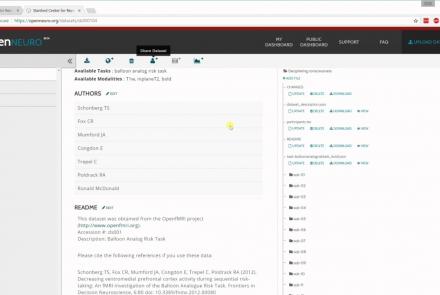
This tutorial shows how to share your data in OpenNeuro.org.
Difficulty level: Beginner
Duration: 1:22
Speaker: : OpenNeuro

Course:
Following the previous two tutorials on uploading and sharing data with OpenNeuro.org, this tutorial briefly covers how to run various analyses on your datasets.
Difficulty level: Beginner
Duration: 2:26
Speaker: : OpenNeuro

Course:
This lesson gives a quick walkthrough the Tidyverse, an "opinionated" collection of R packages designed for data science, including the use of readr, dplyr, tidyr, and ggplot2.
Difficulty level: Beginner
Duration: 1:01:39
Speaker: : Thomas Mock