Lesson type
Difficulty level

Course:
Brief introduction to Research Resource Identifiers (RRIDs), persistent and unique identifiers for referencing a research resource.
Difficulty level: Beginner
Duration: 1:30
Speaker: : Anita Bandrowski

Research Resource Identifiers (RRIDs) are ID numbers assigned to help researchers cite key resources (e.g., antibodies, model organisms, and software projects) in biomedical literature to improve the transparency of research methods.
Difficulty level: Beginner
Duration: 1:01:36
Speaker: : Maryann Martone

Course:
The Mouse Phenome Database (MPD) provides access to primary experimental trait data, genotypic variation, protocols and analysis tools for mouse genetic studies. Data are contributed by investigators worldwide and represent a broad scope of phenotyping endpoints and disease-related traits in naïve mice and those exposed to drugs, environmental agents or other treatments. MPD ensures rigorous curation of phenotype data and supporting documentation using relevant ontologies and controlled vocabularies. As a repository of curated and integrated data, MPD provides a means to access/re-use baseline data, as well as allows users to identify sensitized backgrounds for making new mouse models with genome editing technologies, analyze trait co-inheritance, benchmark assays in their own laboratories, and many other research applications. MPD’s primary source of funding is NIDA. For this reason, a majority of MPD data is neuro- and behavior-related.
Difficulty level: Beginner
Duration: 55:36
Speaker: : Elissa Chesler

This lecture covers a wide range of aspects regarding neuroinformatics and data governance, describing both their historical developments and current trajectories. Particular tools, platforms, and standards to make your research more FAIR are also discussed.
Difficulty level: Beginner
Duration: 54:58
Speaker: : Franco Pestilli

Course:
Longitudinal Online Research and Imaging System (LORIS) is a web-based data and project management software for neuroimaging research studies. It is an open source framework for storing and processing behavioural, clinical, neuroimaging and genetic data. LORIS also makes it easy to manage large datasets acquired over time in a longitudinal study, or at different locations in a large multi-site study.
Difficulty level: Beginner
Duration: 0:35
Speaker: : Samir Das

Course:
This video demonstrates each required step for preprocessing T1w anatomical data in brainlife.io.
Difficulty level: Beginner
Duration: 3:28
Speaker: :

The Allen Mouse Brain Atlas is a genome-wide, high-resolution atlas of gene expression throughout the adult mouse brain. This tutorial describes the basic search and navigation features of the Allen Mouse Brain Atlas.
Difficulty level: Beginner
Duration: 6:40
Speaker: : Allen Institute for Brain Science

The Allen Developing Mouse Brain Atlas is a detailed atlas of gene expression across mouse brain development. This tutorial describes the basic search and navigation features of the Allen Developing Mouse Brain Atlas.
Difficulty level: Beginner
Duration: 6:35
Speaker: : Unknown

This tutorial demonstrates how to use the differential search feature of the Allen Mouse Brain Atlas to find gene markers for different regions of the brain, as well as to visualize this gene expression in three-dimensional space. Differential search is also available for the Allen Developing Mouse Brain Atlas and the Allen Human Brain Atlas.
Difficulty level: Beginner
Duration: 6:31
Speaker: : Unknown

Course:
This module covers some basic anatomy such as the brain’s major divisions (brainstem, cerebellum, cerebrum), the cerebral lobes (frontal, temporal, parietal, and occipital), the central and peripheral nervous systems, theories of cognition, and brain orientation terms.
Difficulty level: Beginner
Duration: 11:54
Speaker: : Harrison Canning

This lesson continues with the second workshop on reproducible science, focusing on additional open source tools for researchers and data scientists, such as the R programming language for data science, as well as associated tools like RStudio and R Markdown. Additionally, users are introduced to Python and iPython notebooks, Google Colab, and are given hands-on tutorials on how to create a Binder environment, as well as various containers in Docker and Singularity.
Difficulty level: Beginner
Duration: 1:16:04
Speaker: : Erin Dickie and Sejal Patel

This lesson contains both a lecture and a tutorial component. The lecture (0:00-20:03 of YouTube video) discusses both the need for intersectional approaches in healthcare as well as the impact of neglecting intersectionality in patient populations. The lecture is followed by a practical tutorial in both Python and R on how to assess intersectional bias in datasets. Links to relevant code and data are found below.
Difficulty level: Beginner
Duration: 52:26

In this hands-on session, you will learn how to explore and work with DataLad datasets, containers, and structures using Jupyter notebooks.
Difficulty level: Beginner
Duration: 58:05
Speaker: : Michał Szczepanik

Course:
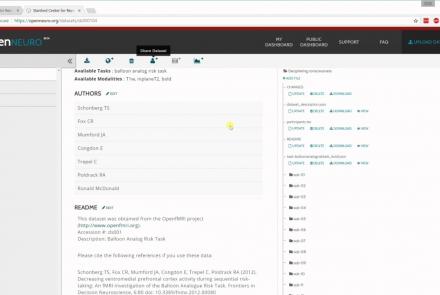
In this tutorial, you will learn the basic features of uploading and versioning your data within OpenNeuro.org.
Difficulty level: Beginner
Duration: 5:36
Speaker: : OpenNeuro
Course:
This tutorial shows how to share your data in OpenNeuro.org.
Difficulty level: Beginner
Duration: 1:22
Speaker: : OpenNeuro

Course:
Following the previous two tutorials on uploading and sharing data with OpenNeuro.org, this tutorial briefly covers how to run various analyses on your datasets.
Difficulty level: Beginner
Duration: 2:26
Speaker: : OpenNeuro

This talk highlights a set of platform technologies, software, and data collections that close and shorten the feedback cycle in research.
Difficulty level: Beginner
Duration: 57:52
Speaker: : Satrajit Ghosh

Course:
This lesson gives a quick walkthrough the Tidyverse, an "opinionated" collection of R packages designed for data science, including the use of readr, dplyr, tidyr, and ggplot2.
Difficulty level: Beginner
Duration: 1:01:39
Speaker: : Thomas Mock

Course:
An introduction to data management, manipulation, visualization, and analysis for neuroscience. Students will learn scientific programming in Python, and use this to work with example data from areas such as cognitive-behavioral research, single-cell recording, EEG, and structural and functional MRI. Basic signal processing techniques including filtering are covered. The course includes a Jupyter Notebook and video tutorials.
Difficulty level: Beginner
Duration: 1:09:16
Speaker: : Aaron J. Newman

Course:
This video will document the process of uploading data into a brainlife project using ezBIDS.
Difficulty level: Beginner
Duration: 6:15
Speaker: :