Lesson type
Difficulty level

This lesson contains both a lecture and a tutorial component. The lecture (0:00-20:03 of YouTube video) discusses both the need for intersectional approaches in healthcare as well as the impact of neglecting intersectionality in patient populations. The lecture is followed by a practical tutorial in both Python and R on how to assess intersectional bias in datasets. Links to relevant code and data are found below.
Difficulty level: Beginner
Duration: 52:26

Course:
This video will document the process of uploading data into a brainlife project using ezBIDS.
Difficulty level: Beginner
Duration: 6:15
Speaker: :
Course:
This video will document the process of visualizing the provenance of each step performed to generate a data object on brainlife.
Difficulty level: Beginner
Duration: 0:21
Speaker: :

Course:
This video will document the process of downloading and running the "reproduce.sh" script, which will automatically run all of the steps to generate a data object locally on a user's machine.
Difficulty level: Beginner
Duration: 3:44
Speaker: :

Course:
This brief video walks you through the steps necessary when creating a project on brainlife.io.
Difficulty level: Beginner
Duration: 1:45
Speaker: :

Course:
This brief video rus through how to make an accout on brainlife.io.
Difficulty level: Beginner
Duration: 0:30
Speaker: :

Course:
This short video shows how data in a brainlife.io publication can be opened from a DOI inside a published article. The video provides an example of how the DOI deposited on the journal can be opened with a web browser to redirect to the associated data publication on brainlife.io.
Difficulty level: Beginner
Duration: 2:18
Speaker: :

Course:
This tutorial is part 1 of 2. It aims to provide viewers with an understanding of the fundamentals of R tool. Note: parts 1 and 2 of this tutorial are part of the same YouTube video; part 1 ends at 17:42.
Difficulty level: Beginner
Duration: 17:42
Speaker: : Edureka

This lesson introduces the practical usage of The Virtual Brain (TVB) in its graphical user interface and via python scripts. In the graphical user interface, you are guided through its data repository, simulator, phase plane exploration tool, connectivity editor, stimulus generator, and the provided analyses. The implemented iPython notebooks of TVB are presented, and since they are public, can be used for further exploration of TVB.
Difficulty level: Beginner
Duration: 1:12:24
Speaker: : Paul Triebkorn

Research Resource Identifiers (RRIDs) are ID numbers assigned to help researchers cite key resources (e.g., antibodies, model organisms, and software projects) in biomedical literature to improve the transparency of research methods.
Difficulty level: Beginner
Duration: 1:01:36
Speaker: : Maryann Martone

Course:
This lesson introduces the EEGLAB toolbox, as well as motivations for its use.
Difficulty level: Beginner
Duration: 15:32
Speaker: : Arnaud Delorme
Course:
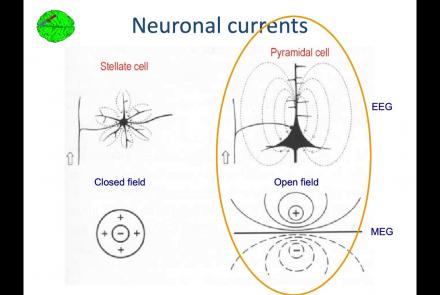
In this lesson, you will learn about the biological activity which generates and is measured by the EEG signal.
Difficulty level: Beginner
Duration: 6:53
Speaker: : Arnaud Delorme

Course:
This lesson goes over the characteristics of EEG signals when analyzed in source space (as opposed to sensor space).
Difficulty level: Beginner
Duration: 10:56
Speaker: : Arnaud Delorme

Course:
This lesson describes the development of EEGLAB as well as to what extent it is used by the research community.
Difficulty level: Beginner
Duration: 6:06
Speaker: : Arnaud Delorme

Course:
This lesson provides instruction as to how to build a processing pipeline in EEGLAB for a single participant.
Difficulty level: Beginner
Duration: 9:20
Speaker: :

Course:
Whereas the previous lesson of this course outlined how to build a processing pipeline for a single participant, this lesson discusses analysis pipelines for multiple participants simultaneously.
Difficulty level: Beginner
Duration: 10:55
Speaker: : Arnaud Delorme

Course:
In addition to outlining the motivations behind preprocessing EEG data in general, this lesson covers the first step in preprocessing data with EEGLAB, importing raw data.
Difficulty level: Beginner
Duration: 8:30
Speaker: : Arnaud Delorme

Course:
Continuing along the EEGLAB preprocessing pipeline, this tutorial walks users through how to import data events as well as EEG channel locations.
Difficulty level: Beginner
Duration: 11:53
Speaker: : Arnaud Delorme

Course:
This tutorial demonstrates how to re-reference and resample raw data in EEGLAB, why such steps are important or useful in the preprocessing pipeline, and how choices made at this step may affect subsequent analyses.
Difficulty level: Beginner
Duration: 11:48
Speaker: : Arnaud Delorme

Course:
This tutorial instructs users how to visually inspect partially pre-processed neuroimaging data in EEGLAB, specifically how to use the data browser to investigate specific channels, epochs, or events for removable artifacts, biological (e.g., eye blinks, muscle movements, heartbeat) or otherwise (e.g., corrupt channel, line noise).
Difficulty level: Beginner
Duration: 5:08
Speaker: : Arnaud Delorme