Lesson type
Difficulty level

Explore how to setup an epileptic seizure simulation with the TVB graphical user interface. This lesson will show you how to program the epileptor model in the brain network to simulate a epileptic seizure originating in the hippocampus. It will also show how to upload and view mouse connectivity data, as well as give a short introduction to the python script interface of TVB.
Difficulty level: Intermediate
Duration: 58:06
Speaker: : Paul Triebkorn

Course:
In this lesson you will learn how to simulate seizure events and epilepsy in The Virtual Brain. We will look at the paper On the Nature of Seizure Dynamics, which describes a new local model called the Epileptor, and apply this same model in The Virtual Brain. This is part 1 of 2 in a series explaining how to use the Epileptor. In this part, we focus on setting up the parameters.
Difficulty level: Beginner
Duration: 4:44
Speaker: : Paul Triebkorn

Manipulate the default connectome provided with TVB to see how structural lesions effect brain dynamics. In this hands-on session you will insert lesions into the connectome within the TVB graphical user interface (GUI). Afterwards, the modified connectome will be used for simulations and the resulting activity will be analysed using functional connectivity.
Difficulty level: Beginner
Duration: 31:22
Speaker: : Paul Triebkorn

This talk highlights a set of platform technologies, software, and data collections that close and shorten the feedback cycle in research.
Difficulty level: Beginner
Duration: 57:52
Speaker: : Satrajit Ghosh

Course:
EyeWire is a game to map the brain. Players are challenged to map branches of a neuron from one side of a cube to the other in a 3D puzzle. Players scroll through the cube and reconstruct neurons with the help of an artificial intelligence algorithm developed at Seung Lab in Princeton University. EyeWire gameplay advances neuroscience by helping researchers discover how neurons connect to process visual information.
Difficulty level: Beginner
Duration: 03:56
Speaker: : EyeWire


This lesson provides an overview of how to construct computational pipelines for neurophysiological data using DataJoint.
Difficulty level: Beginner
Duration: 17:37
Speaker: : Dimitri Yatsenko

Following the previous lesson on neuronal structure, this lesson discusses neuronal function, particularly focusing on spike triggering and propogation.
Difficulty level: Intermediate
Duration: 6:58
Speaker: : Marcus Ghosh

This lesson continues with the second workshop on reproducible science, focusing on additional open source tools for researchers and data scientists, such as the R programming language for data science, as well as associated tools like RStudio and R Markdown. Additionally, users are introduced to Python and iPython notebooks, Google Colab, and are given hands-on tutorials on how to create a Binder environment, as well as various containers in Docker and Singularity.
Difficulty level: Beginner
Duration: 1:16:04
Speaker: : Erin Dickie and Sejal Patel

This is a hands-on tutorial on PLINK, the open source whole genome association analysis toolset. The aims of this tutorial are to teach users how to perform basic quality control on genetic datasets, as well as to identify and understand GWAS summary statistics.
Difficulty level: Intermediate
Duration: 1:27:18
Speaker: : Dan Felsky

This is a tutorial on using the open-source software PRSice to calculate a set of polygenic risk scores (PRS) for a study sample. Users will also learn how to read PRS into R, visualize distributions, and perform basic association analyses.
Difficulty level: Intermediate
Duration: 1:53:34
Speaker: : Dan Felsky

This is a tutorial introducing participants to the basics of RNA-sequencing data and how to analyze its features using Seurat.
Difficulty level: Intermediate
Duration: 1:19:17
Speaker: : Sonny Chen

This tutorial demonstrates how to perform cell-type deconvolution in order to estimate how proportions of cell-types in the brain change in response to various conditions. While these techniques may be useful in addressing a wide range of scientific questions, this tutorial will focus on the cellular changes associated with major depression (MDD).
Difficulty level: Intermediate
Duration: 1:15:14
Speaker: : Keon Arbabi

In this third and final hands-on tutorial from the Research Workflows for Collaborative Neuroscience workshop, you will learn about workflow orchestration using open source tools like DataJoint and Flyte.
Difficulty level: Intermediate
Duration: 22:36
Speaker: : Daniel Xenes

This lecture covers a wide range of aspects regarding neuroinformatics and data governance, describing both their historical developments and current trajectories. Particular tools, platforms, and standards to make your research more FAIR are also discussed.
Difficulty level: Beginner
Duration: 54:58
Speaker: : Franco Pestilli

Course:
In this tutorial, you will learn the basic features of uploading and versioning your data within OpenNeuro.org.
Difficulty level: Beginner
Duration: 5:36
Speaker: : OpenNeuro
Course:
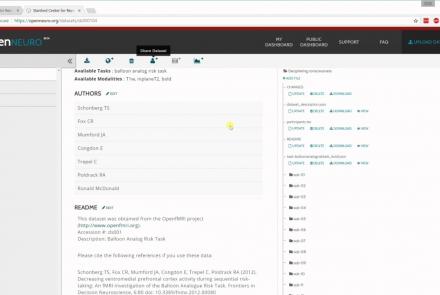
This tutorial shows how to share your data in OpenNeuro.org.
Difficulty level: Beginner
Duration: 1:22
Speaker: : OpenNeuro

Course:
Following the previous two tutorials on uploading and sharing data with OpenNeuro.org, this tutorial briefly covers how to run various analyses on your datasets.
Difficulty level: Beginner
Duration: 2:26
Speaker: : OpenNeuro

Course:
This lesson gives a quick walkthrough the Tidyverse, an "opinionated" collection of R packages designed for data science, including the use of readr, dplyr, tidyr, and ggplot2.
Difficulty level: Beginner
Duration: 1:01:39
Speaker: : Thomas Mock

In this session the Medical Informatics Platform (MIP) federated analytics is presented. The current and future analytical tools implemented in the MIP will be detailed along with the constructs, tools, processes, and restrictions that formulate the solution provided. MIP is a platform providing advanced federated analytics for diagnosis and research in clinical neuroscience research. It is targeting clinicians, clinical scientists and clinical data scientists. It is designed to help adopt advanced analytics, explore harmonized medical data of neuroimaging, neurophysiological and medical records as well as research cohort datasets, without transferring original clinical data. It can be perceived as a virtual database that seamlessly presents aggregated data from distributed sources, provides access and analyze imaging and clinical data, securely stored in hospitals, research archives and public databases. It leverages and re-uses decentralized patient data and research cohort datasets, without transferring original data. Integrated statistical analysis tools and machine learning algorithms are exposed over harmonized, federated medical data.
Difficulty level: Intermediate
Duration: 15:05
Speaker: : Giorgos Papanikos