Lesson type
Difficulty level

Manipulate the default connectome provided with TVB to see how structural lesions effect brain dynamics. In this hands-on session you will insert lesions into the connectome within the TVB graphical user interface (GUI). Afterwards, the modified connectome will be used for simulations and the resulting activity will be analysed using functional connectivity.
Difficulty level: Beginner
Duration: 31:22
Speaker: : Paul Triebkorn

In this lesson, you will learn in more detail about neuromorphic computing, that is, non-standard computational architectures that mimic some aspect of the way the brain works.
Difficulty level: Intermediate
Duration: 10:08
Speaker: : Dan Goodman

This video provides a very quick introduction to some of the neuromorphic sensing devices, and how they offer unique, low-power applications.
Difficulty level: Intermediate
Duration: 2:37
Speaker: : Dan Goodman

This lesson continues with the second workshop on reproducible science, focusing on additional open source tools for researchers and data scientists, such as the R programming language for data science, as well as associated tools like RStudio and R Markdown. Additionally, users are introduced to Python and iPython notebooks, Google Colab, and are given hands-on tutorials on how to create a Binder environment, as well as various containers in Docker and Singularity.
Difficulty level: Beginner
Duration: 1:16:04
Speaker: : Erin Dickie and Sejal Patel

This is a tutorial introducing participants to the basics of RNA-sequencing data and how to analyze its features using Seurat.
Difficulty level: Intermediate
Duration: 1:19:17
Speaker: : Sonny Chen

Course:
This demonstration walks through how to import your data into MATLAB.
Difficulty level: Beginner
Duration: 6:10
Speaker: : MATLAB®

Course:
This lesson provides instruction regarding the various factors one must consider when preprocessing data, preparing it for statistical exploration and analyses.
Difficulty level: Beginner
Duration: 15:10
Speaker: : MATLAB®

Course:
This tutorial outlines, step by step, how to perform analysis by group and how to do change-point detection.
Difficulty level: Beginner
Duration: 2:49
Speaker: : MATLAB®

Course:
This tutorial walks through several common methods for visualizing your data in different ways depending on your data type.
Difficulty level: Beginner
Duration: 6:10
Speaker: : MATLAB®

Course:
This tutorial illustrates several ways to approach predictive modeling and machine learning with MATLAB.
Difficulty level: Beginner
Duration: 6:27
Speaker: : MATLAB®

Course:
This brief tutorial goes over how you can easily work with big data as you would with any size of data.
Difficulty level: Beginner
Duration: 3:55
Speaker: : MATLAB®

Course:
In this tutorial, you will learn how to deploy your models outside of your local MATLAB environment, enabling wider sharing and collaboration.
Difficulty level: Beginner
Duration: 3:52
Speaker: : MATLAB®

Course:
This lesson provides a brief overview of the Python programming language, with an emphasis on tools relevant to data scientists.
Difficulty level: Beginner
Duration: 1:16:36
Speaker: : Tal Yarkoni

Course:
This tutorial teaches users how to use Pandas objects to help store and manipulate various datasets in Python.
Difficulty level: Beginner
Duration: 1:21:40
Speaker: : Tal Yarkoni

Course:
This lesson gives a quick walkthrough the Tidyverse, an "opinionated" collection of R packages designed for data science, including the use of readr, dplyr, tidyr, and ggplot2.
Difficulty level: Beginner
Duration: 1:01:39
Speaker: : Thomas Mock

Course:
This lesson describes the principles underlying functional magnetic resonance imaging (fMRI), diffusion-weighted imaging (DWI), tractography, and parcellation. These tools and concepts are explained in a broader context of neural connectivity and mental health.
Difficulty level: Intermediate
Duration: 1:47:22
Speaker: : Erin Dickie and John Griffiths

This talk covers the differences between applying HED annotation to fMRI datasets versus other neuroimaging practices, and also introduces an analysis pipeline using HED tags.
Difficulty level: Beginner
Duration: 22:52
Speaker: : Monique Denissen

This lesson explores how researchers try to understand neural networks, particularly in the case of observing neural activity.
Difficulty level: Intermediate
Duration: 8:20
Speaker: : Marcus Ghosh
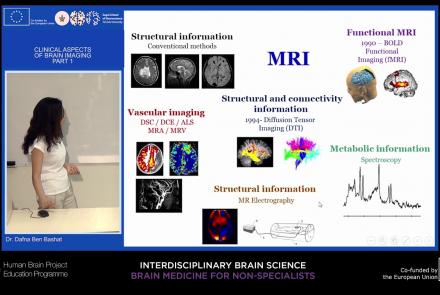
This lecture will provide an overview of neuroimaging techniques and their clinical applications.
Difficulty level: Beginner
Duration: 45:29
Speaker: : Dafna Ben Bashat

Course:
Longitudinal Online Research and Imaging System (LORIS) is a web-based data and project management software for neuroimaging research studies. It is an open source framework for storing and processing behavioural, clinical, neuroimaging and genetic data. LORIS also makes it easy to manage large datasets acquired over time in a longitudinal study, or at different locations in a large multi-site study.
Difficulty level: Beginner
Duration: 0:35
Speaker: : Samir Das