Explore how to setup an epileptic seizure simulation with the TVB graphical user interface. This lesson will show you how to program the epileptor model in the brain network to simulate a epileptic seizure originating in the hippocampus. It will also show how to upload and view mouse connectivity data, as well as give a short introduction to the python script interface of TVB.
Difficulty level: Intermediate
Duration: 58:06
Speaker: : Paul Triebkorn
Course:
In this lesson you will learn how to simulate seizure events and epilepsy in The Virtual Brain. We will look at the paper On the Nature of Seizure Dynamics, which describes a new local model called the Epileptor, and apply this same model in The Virtual Brain. This is part 1 of 2 in a series explaining how to use the Epileptor. In this part, we focus on setting up the parameters.
Difficulty level: Beginner
Duration: 4:44
Speaker: : Paul Triebkorn
Manipulate the default connectome provided with TVB to see how structural lesions effect brain dynamics. In this hands-on session you will insert lesions into the connectome within the TVB graphical user interface (GUI). Afterwards, the modified connectome will be used for simulations and the resulting activity will be analysed using functional connectivity.
Difficulty level: Beginner
Duration: 31:22
Speaker: : Paul Triebkorn
This lesson gives an overview of the Brainstorm package for analyzing extracellular electrophysiology, including preprocessing, spike sorting, trial alignment, and spectrotemporal decomposition.
Difficulty level: Intermediate
Duration: 47:47
Speaker: : Konstantinos Nasiotis
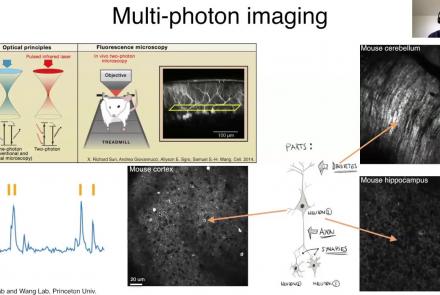
This lesson provides an overview of the CaImAn package, as well as a demonstration of usage with NWB.
Difficulty level: Intermediate
Duration: 44:37
Speaker: : Andrea Giovannucci
This lesson gives an overview of the SpikeInterface package, including demonstration of data loading, preprocessing, spike sorting, and comparison of spike sorters.
Difficulty level: Intermediate
Duration: 1:10:28
Speaker: : Alessio Buccino
In this lesson, users will learn about the NWBWidgets package, including coverage of different data types, and information for building custom widgets within this framework.
Difficulty level: Intermediate
Duration: 47:15
Speaker: : Ben Dichter
This video explains what metadata is, why it is important, and how you can organize your metadata to increase the FAIRness of your data on EBRAINS.
Difficulty level: Beginner
Duration: 17:23
Speaker: : Ulrike Schlegel
Course:
This tutorial introduces pipelines and methods to compute brain connectomes from fMRI data. With corresponding code and repositories, participants can follow along and learn how to programmatically preprocess, curate, and analyze functional and structural brain data to produce connectivity matrices.
Difficulty level: Intermediate
Duration: 1:39:04
Speaker: : Erin Dickie and John Griffiths
Course:
EyeWire is a game to map the brain. Players are challenged to map branches of a neuron from one side of a cube to the other in a 3D puzzle. Players scroll through the cube and reconstruct neurons with the help of an artificial intelligence algorithm developed at Seung Lab in Princeton University. EyeWire gameplay advances neuroscience by helping researchers discover how neurons connect to process visual information.
Difficulty level: Beginner
Duration: 03:56
Speaker: : EyeWire
Course:
This module explains how neurons come together to create the networks that give rise to our thoughts. The totality of our neurons and their connection is called our connectome. Learn how this connectome changes as we learn, and computes information.
Difficulty level: Beginner
Duration: 7:13
Speaker: : Harrison Canning
This lesson provides an overview of how to construct computational pipelines for neurophysiological data using DataJoint.
Difficulty level: Beginner
Duration: 17:37
Speaker: : Dimitri Yatsenko
Following the previous lesson on neuronal structure, this lesson discusses neuronal function, particularly focusing on spike triggering and propogation.
Difficulty level: Intermediate
Duration: 6:58
Speaker: : Marcus Ghosh
This is a tutorial on designing a Bayesian inference model to map belief trajectories, with emphasis on gaining familiarity with Hierarchical Gaussian Filters (HGFs).
This lesson corresponds to slides 65-90 of the PDF below.
Difficulty level: Intermediate
Duration: 1:15:04
Speaker: : Daniel Hauke
Course:
JupyterHub is a simple, highly extensible, multi-user system for managing per-user Jupyter Notebook servers, designed for research groups or classes. This lecture covers deploying JupyterHub on a single server, as well as deploying with Docker using GitHub for authentication.
Difficulty level: Beginner
Duration: 1:36:27
Speaker: : Thomas Kluyver
Course:
This demonstration walks through how to import your data into MATLAB.
Difficulty level: Beginner
Duration: 6:10
Speaker: : MATLAB®
Course:
This lesson provides instruction regarding the various factors one must consider when preprocessing data, preparing it for statistical exploration and analyses.
Difficulty level: Beginner
Duration: 15:10
Speaker: : MATLAB®
Course:
This tutorial outlines, step by step, how to perform analysis by group and how to do change-point detection.
Difficulty level: Beginner
Duration: 2:49
Speaker: : MATLAB®
Course:
This tutorial walks through several common methods for visualizing your data in different ways depending on your data type.
Difficulty level: Beginner
Duration: 6:10
Speaker: : MATLAB®
Topics
- Standards and Best Practices (3)
- Provenance (2)
- Artificial Intelligence (1)
- protein-protein interactions (1)
- Extracellular signaling (1)
- Animal models (2)
- Assembly 2021 (6)
- Brain-hardware interfaces (12)
- Clinical neuroscience (3)
- Repositories and science gateways (1)
- Resources (3)
- General neuroscience (16)
- Phenome (1)
- General neuroinformatics
(1)
- Computational neuroscience (95)
- Statistics (5)
- Computer Science (6)
- Genomics (31)
- (-) Data science (19)
- Open science (33)
- Project management (1)
- Education (2)
- Publishing (1)
- Neuroethics (1)


