Lesson type
Difficulty level

Course:
The Mouse Phenome Database (MPD) provides access to primary experimental trait data, genotypic variation, protocols and analysis tools for mouse genetic studies. Data are contributed by investigators worldwide and represent a broad scope of phenotyping endpoints and disease-related traits in naïve mice and those exposed to drugs, environmental agents or other treatments. MPD ensures rigorous curation of phenotype data and supporting documentation using relevant ontologies and controlled vocabularies. As a repository of curated and integrated data, MPD provides a means to access/re-use baseline data, as well as allows users to identify sensitized backgrounds for making new mouse models with genome editing technologies, analyze trait co-inheritance, benchmark assays in their own laboratories, and many other research applications. MPD’s primary source of funding is NIDA. For this reason, a majority of MPD data is neuro- and behavior-related.
Difficulty level: Beginner
Duration: 55:36
Speaker: : Elissa Chesler

Course:
This lesson introduces the EEGLAB toolbox, as well as motivations for its use.
Difficulty level: Beginner
Duration: 15:32
Speaker: : Arnaud Delorme
Course:
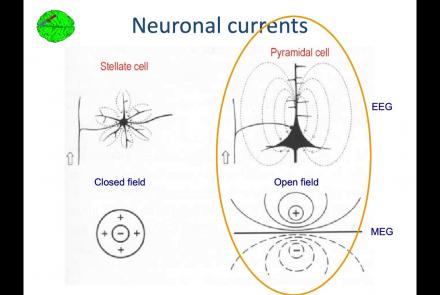
In this lesson, you will learn about the biological activity which generates and is measured by the EEG signal.
Difficulty level: Beginner
Duration: 6:53
Speaker: : Arnaud Delorme

Course:
This lesson goes over the characteristics of EEG signals when analyzed in source space (as opposed to sensor space).
Difficulty level: Beginner
Duration: 10:56
Speaker: : Arnaud Delorme

Course:
This lesson describes the development of EEGLAB as well as to what extent it is used by the research community.
Difficulty level: Beginner
Duration: 6:06
Speaker: : Arnaud Delorme

Course:
This lesson provides instruction as to how to build a processing pipeline in EEGLAB for a single participant.
Difficulty level: Beginner
Duration: 9:20
Speaker: :

Course:
Whereas the previous lesson of this course outlined how to build a processing pipeline for a single participant, this lesson discusses analysis pipelines for multiple participants simultaneously.
Difficulty level: Beginner
Duration: 10:55
Speaker: : Arnaud Delorme

Course:
In addition to outlining the motivations behind preprocessing EEG data in general, this lesson covers the first step in preprocessing data with EEGLAB, importing raw data.
Difficulty level: Beginner
Duration: 8:30
Speaker: : Arnaud Delorme

Course:
Continuing along the EEGLAB preprocessing pipeline, this tutorial walks users through how to import data events as well as EEG channel locations.
Difficulty level: Beginner
Duration: 11:53
Speaker: : Arnaud Delorme

Course:
This tutorial demonstrates how to re-reference and resample raw data in EEGLAB, why such steps are important or useful in the preprocessing pipeline, and how choices made at this step may affect subsequent analyses.
Difficulty level: Beginner
Duration: 11:48
Speaker: : Arnaud Delorme

Course:
This tutorial instructs users how to visually inspect partially pre-processed neuroimaging data in EEGLAB, specifically how to use the data browser to investigate specific channels, epochs, or events for removable artifacts, biological (e.g., eye blinks, muscle movements, heartbeat) or otherwise (e.g., corrupt channel, line noise).
Difficulty level: Beginner
Duration: 5:08
Speaker: : Arnaud Delorme

Course:
This tutorial provides instruction on how to use EEGLAB to further preprocess EEG datasets by identifying and discarding bad channels which, if left unaddressed, can corrupt and confound subsequent analysis steps.
Difficulty level: Beginner
Duration: 13:01
Speaker: : Arnaud Delorme

Course:
Users following this tutorial will learn how to identify and discard bad EEG data segments using the MATLAB toolbox EEGLAB.
Difficulty level: Beginner
Duration: 11:25
Speaker: : Arnaud Delorme

Course:
This module covers many of the types of non-invasive neurotech and neuroimaging devices including electroencephalography (EEG), electromyography (EMG), electroneurography (ENG), magnetoencephalography (MEG), and more.
Difficulty level: Beginner
Duration: 13:36
Speaker: : Harrison Canning

Course:
This tutorial introduces pipelines and methods to compute brain connectomes from fMRI data. With corresponding code and repositories, participants can follow along and learn how to programmatically preprocess, curate, and analyze functional and structural brain data to produce connectivity matrices.
Difficulty level: Intermediate
Duration: 1:39:04
Speaker: : Erin Dickie and John Griffiths

This lesson introduces the practical exercises which accompany the previous lessons on animal and human connectomes in the brain and nervous system.
Difficulty level: Intermediate
Duration: 4:10
Speaker: : Dan Goodman

Course:
This lecture and tutorial focuses on measuring human functional brain networks, as well as how to account for inherent variability within those networks.
Difficulty level: Intermediate
Duration: 50:44
Speaker: : Caterina Gratton

Course:
This tutorial demonstrates how to work with neuronal data using MATLAB, including actional potentials and spike counts, orientation tuing curves in visual cortex, and spatial maps of firing rates.
Difficulty level: Intermediate
Duration: 5:17
Speaker: : Mike X. Cohen

Course:
This lesson instructs users on how to import electrophysiological neural data into MATLAB, as well as how to convert spikes to a data matrix.
Difficulty level: Intermediate
Duration: 11:37
Speaker: : Mike X. Cohen

Course:
In this lesson, users will learn how to appropriately sort and bin neural spikes, allowing for the generation of a common and powerful visualization tool in neuroscience, the histogram.
Difficulty level: Intermediate
Duration: 5:31
Speaker: : Mike X. Cohen