Research Resource Identifiers (RRIDs) are ID numbers assigned to help researchers cite key resources (e.g., antibodies, model organisms, and software projects) in biomedical literature to improve the transparency of research methods.
Difficulty level: Beginner
Duration: 1:01:36
Speaker: : Maryann Martone
This lecture provides an introduction to the Brain Imaging Data Structure (BIDS), a standard for organizing human neuroimaging datasets.
Difficulty level: Intermediate
Duration: 56:49
Speaker: : Chris Gorgolewski
Course:
This lecture covers the rationale for developing the DAQCORD, a framework for the design, documentation, and reporting of data curation methods in order to advance the scientific rigour, reproducibility, and analysis of data.
Difficulty level: Intermediate
Duration: 17:08
Speaker: : Ari Ercole
Course:
This lesson gives an introduction to high-performance computing with the Compute Canada network, first providing an overview of use cases for HPC and then a hands-on tutorial. Though some examples might seem specific to the Calcul Québec, all computing clusters in the Compute Canada network share the same software modules and environments.
Difficulty level: Beginner
Duration: 02:49:34
Speaker: : Félix-Antoine Fortin
Course:
This talk presents an overview of CBRAIN, a web-based platform that allows neuroscientists to perform computationally intensive data analyses by connecting them to high-performance computing facilities across Canada and around the world.
Difficulty level: Beginner
Duration: 56:07
Speaker: : Shawn Brown
The Allen Mouse Brain Atlas is a genome-wide, high-resolution atlas of gene expression throughout the adult mouse brain. This tutorial describes the basic search and navigation features of the Allen Mouse Brain Atlas.
Difficulty level: Beginner
Duration: 6:40
Speaker: : Allen Institute for Brain Science
The Allen Developing Mouse Brain Atlas is a detailed atlas of gene expression across mouse brain development. This tutorial describes the basic search and navigation features of the Allen Developing Mouse Brain Atlas.
Difficulty level: Beginner
Duration: 6:35
Speaker: : Unknown
This tutorial demonstrates how to use the differential search feature of the Allen Mouse Brain Atlas to find gene markers for different regions of the brain, as well as to visualize this gene expression in three-dimensional space. Differential search is also available for the Allen Developing Mouse Brain Atlas and the Allen Human Brain Atlas.
Difficulty level: Beginner
Duration: 6:31
Speaker: : Unknown
Course:
This lecture covers FAIR atlases, including their background and construction, as well as how they can be created in line with the FAIR principles.
Difficulty level: Beginner
Duration: 14:24
Speaker: : Heidi Kleven
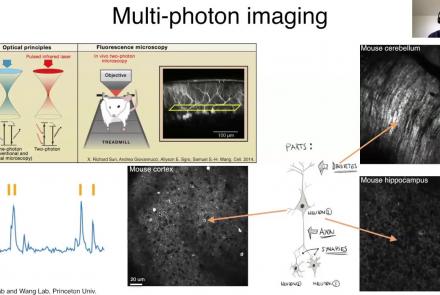
This lecture provides an introduction to optogenetics, a biological technique to control the activity of neurons or other cell types with light.
Difficulty level: Beginner
Duration: 39:34
Speaker: : Adam Packer
This lesson provides an overview of the CaImAn package, as well as a demonstration of usage with NWB.
Difficulty level: Intermediate
Duration: 44:37
Speaker: : Andrea Giovannucci
This lesson gives an overview of the SpikeInterface package, including demonstration of data loading, preprocessing, spike sorting, and comparison of spike sorters.
Difficulty level: Intermediate
Duration: 1:10:28
Speaker: : Alessio Buccino
In this lesson, users will learn about the NWBWidgets package, including coverage of different data types, and information for building custom widgets within this framework.
Difficulty level: Intermediate
Duration: 47:15
Speaker: : Ben Dichter
This video explains what metadata is, why it is important, and how you can organize your metadata to increase the FAIRness of your data on EBRAINS.
Difficulty level: Beginner
Duration: 17:23
Speaker: : Ulrike Schlegel
This lecture provides reviews some standards for project management and organization, including motivation from the view of the FAIR principles and improved reproducibility.
Difficulty level: Beginner
Duration: 01:08:34
Speaker: : Elizabeth DuPre
Course:
This tutorial demonstrates how to work with neuronal data using MATLAB, including actional potentials and spike counts, orientation tuing curves in visual cortex, and spatial maps of firing rates.
Difficulty level: Intermediate
Duration: 5:17
Speaker: : Mike X. Cohen
Course:
This lesson instructs users on how to import electrophysiological neural data into MATLAB, as well as how to convert spikes to a data matrix.
Difficulty level: Intermediate
Duration: 11:37
Speaker: : Mike X. Cohen
Course:
In this lesson, users will learn how to appropriately sort and bin neural spikes, allowing for the generation of a common and powerful visualization tool in neuroscience, the histogram.
Difficulty level: Intermediate
Duration: 5:31
Speaker: : Mike X. Cohen
Course:
Followers of this lesson will learn how to compute, visualize and quantify the tuning curves of individual neurons.
Difficulty level: Intermediate
Duration: 13:48
Speaker: : Mike X. Cohen
Course:
This lesson demonstrates how to programmatically generate a spatial map of neuronal spike counts using MATLAB.
Difficulty level: Intermediate
Duration: 12:16
Speaker: : Mike X. Cohen
Topics
- Artificial Intelligence (5)
- Philosophy of Science (5)
- Notebooks (2)
- Provenance (2)
- protein-protein interactions (1)
- Extracellular signaling (1)
- Animal models (3)
- Assembly 2021 (27)
- Brain-hardware interfaces (13)
- Clinical neuroscience (12)
- International Brain Initiative (2)
- Repositories and science gateways (5)
- Resources (6)
- (-)
General neuroscience
(25)
- Neuroscience (1)
- Cognitive Science (7)
- (-) Cell signaling (4)
- Brain networks (7)
- (-) Glia (1)
- Electrophysiology (12)
- Learning and memory (4)
- Neuroanatomy (9)
- Neurobiology (13)
- Neurodegeneration (1)
- Neuroimmunology (1)
- Neural networks (13)
- Neurophysiology (4)
- (-) Neuropharmacology (1)
- Neuronal plasticity (16)
- Synaptic plasticity (1)
- (-) Visual system (1)
- Phenome (1)
- General neuroinformatics
(1)
- Computational neuroscience (120)
- Statistics (7)
- Computer Science (7)
- Genomics (32)
- Data science
(19)
- Open science (27)
- Project management (3)
- Education (2)
- (-) Neuroethics (7)


