Lesson type
Difficulty level

This is a hands-on tutorial on PLINK, the open source whole genome association analysis toolset. The aims of this tutorial are to teach users how to perform basic quality control on genetic datasets, as well as to identify and understand GWAS summary statistics.
Difficulty level: Intermediate
Duration: 1:27:18
Speaker: : Dan Felsky

This is a tutorial on using the open-source software PRSice to calculate a set of polygenic risk scores (PRS) for a study sample. Users will also learn how to read PRS into R, visualize distributions, and perform basic association analyses.
Difficulty level: Intermediate
Duration: 1:53:34
Speaker: : Dan Felsky

This is a tutorial introducing participants to the basics of RNA-sequencing data and how to analyze its features using Seurat.
Difficulty level: Intermediate
Duration: 1:19:17
Speaker: : Sonny Chen

This tutorial demonstrates how to perform cell-type deconvolution in order to estimate how proportions of cell-types in the brain change in response to various conditions. While these techniques may be useful in addressing a wide range of scientific questions, this tutorial will focus on the cellular changes associated with major depression (MDD).
Difficulty level: Intermediate
Duration: 1:15:14
Speaker: : Keon Arbabi

This is a tutorial on designing a Bayesian inference model to map belief trajectories, with emphasis on gaining familiarity with Hierarchical Gaussian Filters (HGFs).
This lesson corresponds to slides 65-90 of the PDF below.
Difficulty level: Intermediate
Duration: 1:15:04
Speaker: : Daniel Hauke

Similarity Network Fusion (SNF) is a computational method for data integration across various kinds of measurements, aimed at taking advantage of the common as well as complementary information in different data types. This workshop walks participants through running SNF on EEG and genomic data using RStudio.
Difficulty level: Intermediate
Duration: 1:21:38
Speaker: : Dan Felsky

Course:
This demonstration walks through how to import your data into MATLAB.
Difficulty level: Beginner
Duration: 6:10
Speaker: : MATLAB®

Course:
This lesson provides instruction regarding the various factors one must consider when preprocessing data, preparing it for statistical exploration and analyses.
Difficulty level: Beginner
Duration: 15:10
Speaker: : MATLAB®

Course:
This tutorial outlines, step by step, how to perform analysis by group and how to do change-point detection.
Difficulty level: Beginner
Duration: 2:49
Speaker: : MATLAB®

Course:
This tutorial walks through several common methods for visualizing your data in different ways depending on your data type.
Difficulty level: Beginner
Duration: 6:10
Speaker: : MATLAB®

Course:
This tutorial illustrates several ways to approach predictive modeling and machine learning with MATLAB.
Difficulty level: Beginner
Duration: 6:27
Speaker: : MATLAB®

Course:
This brief tutorial goes over how you can easily work with big data as you would with any size of data.
Difficulty level: Beginner
Duration: 3:55
Speaker: : MATLAB®

Course:
In this tutorial, you will learn how to deploy your models outside of your local MATLAB environment, enabling wider sharing and collaboration.
Difficulty level: Beginner
Duration: 3:52
Speaker: : MATLAB®
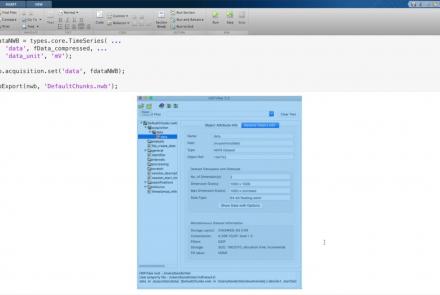
This lesson provides a tutorial on how to handle writing very large data in MatNWB.
Difficulty level: Advanced
Duration: 16:18
Speaker: : Ben Dichter

This lesson provides an overview of the CaImAn package, as well as a demonstration of usage with NWB.
Difficulty level: Intermediate
Duration: 44:37
Speaker: : Andrea Giovannucci

This lesson gives an overview of the SpikeInterface package, including demonstration of data loading, preprocessing, spike sorting, and comparison of spike sorters.
Difficulty level: Intermediate
Duration: 1:10:28
Speaker: : Alessio Buccino

In this lesson, users will learn about the NWBWidgets package, including coverage of different data types, and information for building custom widgets within this framework.
Difficulty level: Intermediate
Duration: 47:15
Speaker: : Ben Dichter

Course:
This lesson gives a quick walkthrough the Tidyverse, an "opinionated" collection of R packages designed for data science, including the use of readr, dplyr, tidyr, and ggplot2.
Difficulty level: Beginner
Duration: 1:01:39
Speaker: : Thomas Mock

This lesson provides a hands-on tutorial for generating simulated brain data within the EBRAINS ecosystem.
Difficulty level: Beginner
Duration: 32:58
Speaker: : Jil Meier